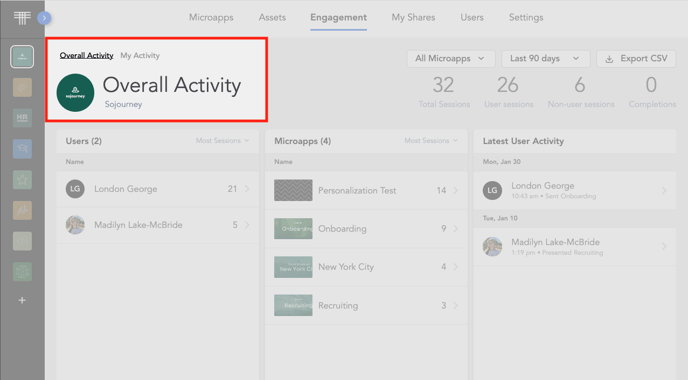
Engagement: Overall Activity
The Overall Activity for a Tiled Library is found in the Engagement section. Every library will have an overview of Total Sessions, User Sessions, Non-user Sessions, and Completions which can be sorted by time frame and microapp. Additionally, the Overall Activity includes information about Tiled users and microapps that have been shared from the library.
Overview
The top right part of the Engagement tab will show a high-level view of usage in a Tiled library. You can filter engagement analytics by microapp(s) over a specific time frame such as Last 7 days, Last 30 days, Last 90 days (default) or Last Year. This information can be exported into a csv. The filters selected will be applied to each section below (Users, Microapps and Latest User Activity).
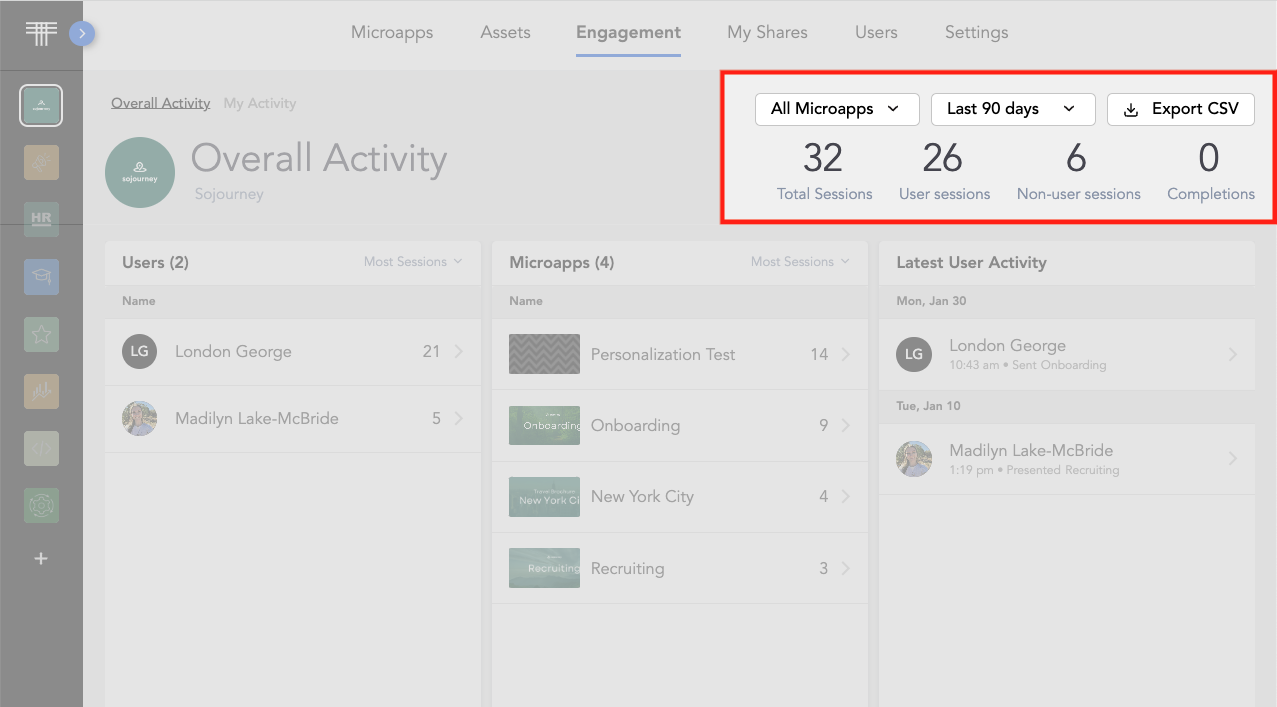
| Term | Definition |
| Total Sessions | The sum of User Sessions and Non-User Sessions. |
| User Sessions | The number of times a microapp has been viewed by a logged-in Tiled User. |
| Non-user sessions | The number of sessions a direct or public microapp link has been viewed by a non Tiled user. |
| Completions | The number of completion events across all microapps in a library. |
User Analytics
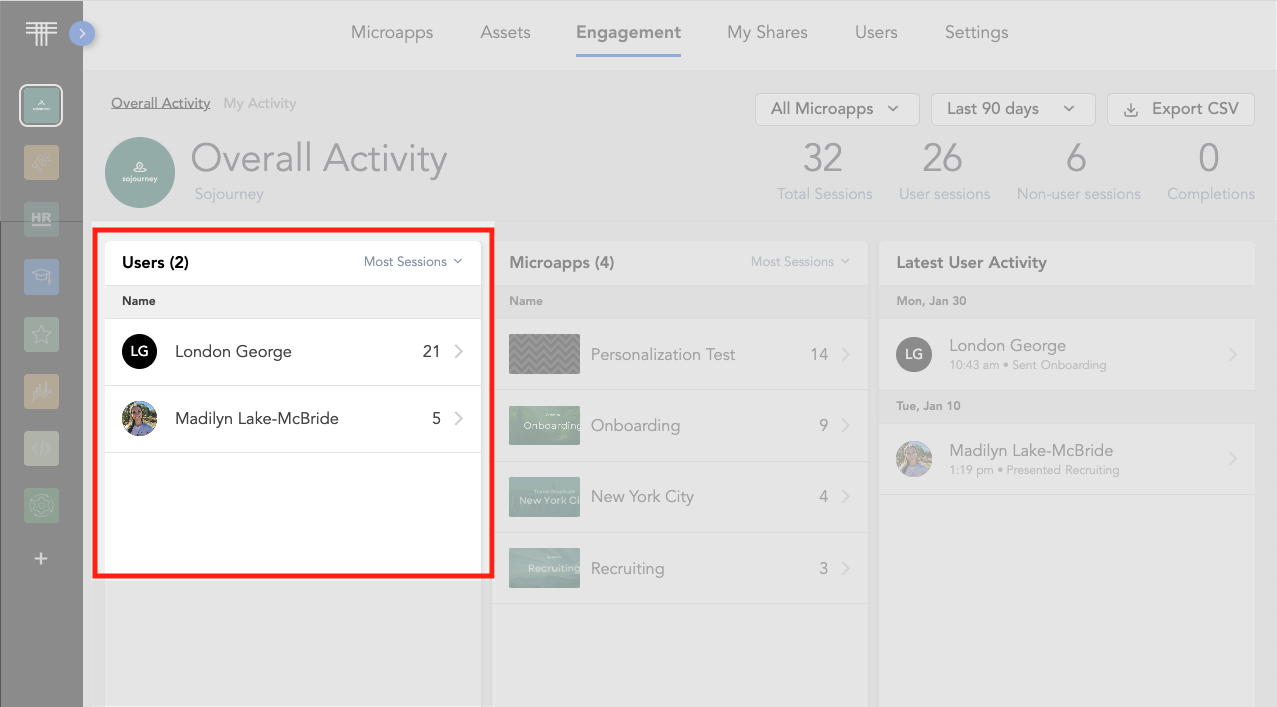
The user Analytics section shows the aggregate number of sessions each user in a library has. You can click into each user to access the User Engagement Analytics. This list can be sorted by Most Sessions (default), Least Sessions, and Alphabetical.
Microapp Analytics
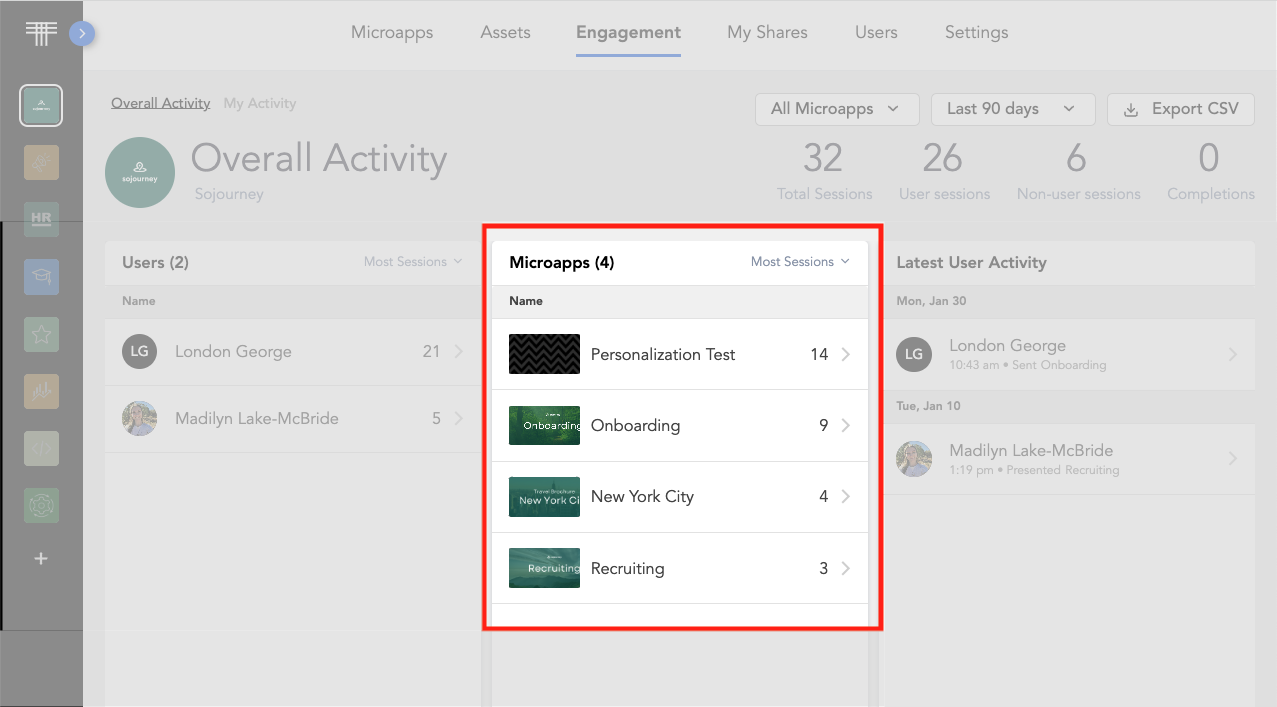
The microapps Analytics sections shows the aggregate number of sessions by microapp. You can click into each microapp to access the Microapp Engagement Analytics view. This list can be sorted by Most Sessions (default), Least Sessions, and Alphabetical.
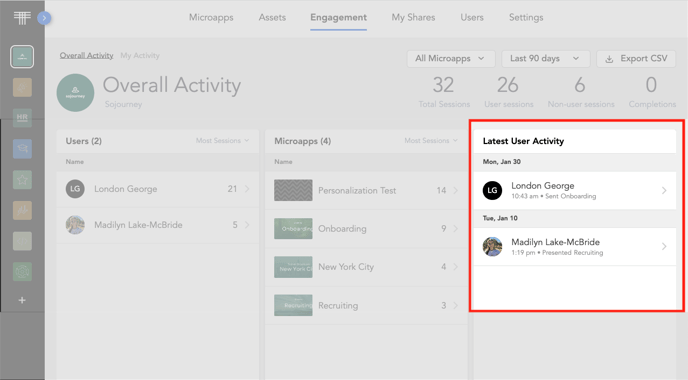
Latest User Activity
The latest user activity will show activity in the library in chronological order by user. This is a helpful view to see the most recent types of activity happening in a library. You can click into each user to access the User Engagement Analytics.
My Activity
Your own activity can be found in the My Activity tab in the top left corner.
