![logo-horizontal_w.png]](https://support.tiled.co/hs-fs/hubfs/logo-horizontal_w.png?height=30&name=logo-horizontal_w.png)
Pathway Analytics are a way to see engagement data on a microapp from a specific user. Since Pathway Analytics are tied to a particular user they are only available for Direct Share Links. Information such as the time spent on a microapp, the tiles that are clicked (or tapped) and other engagement data comprise the Pathway Analytics information.
What You’ll See
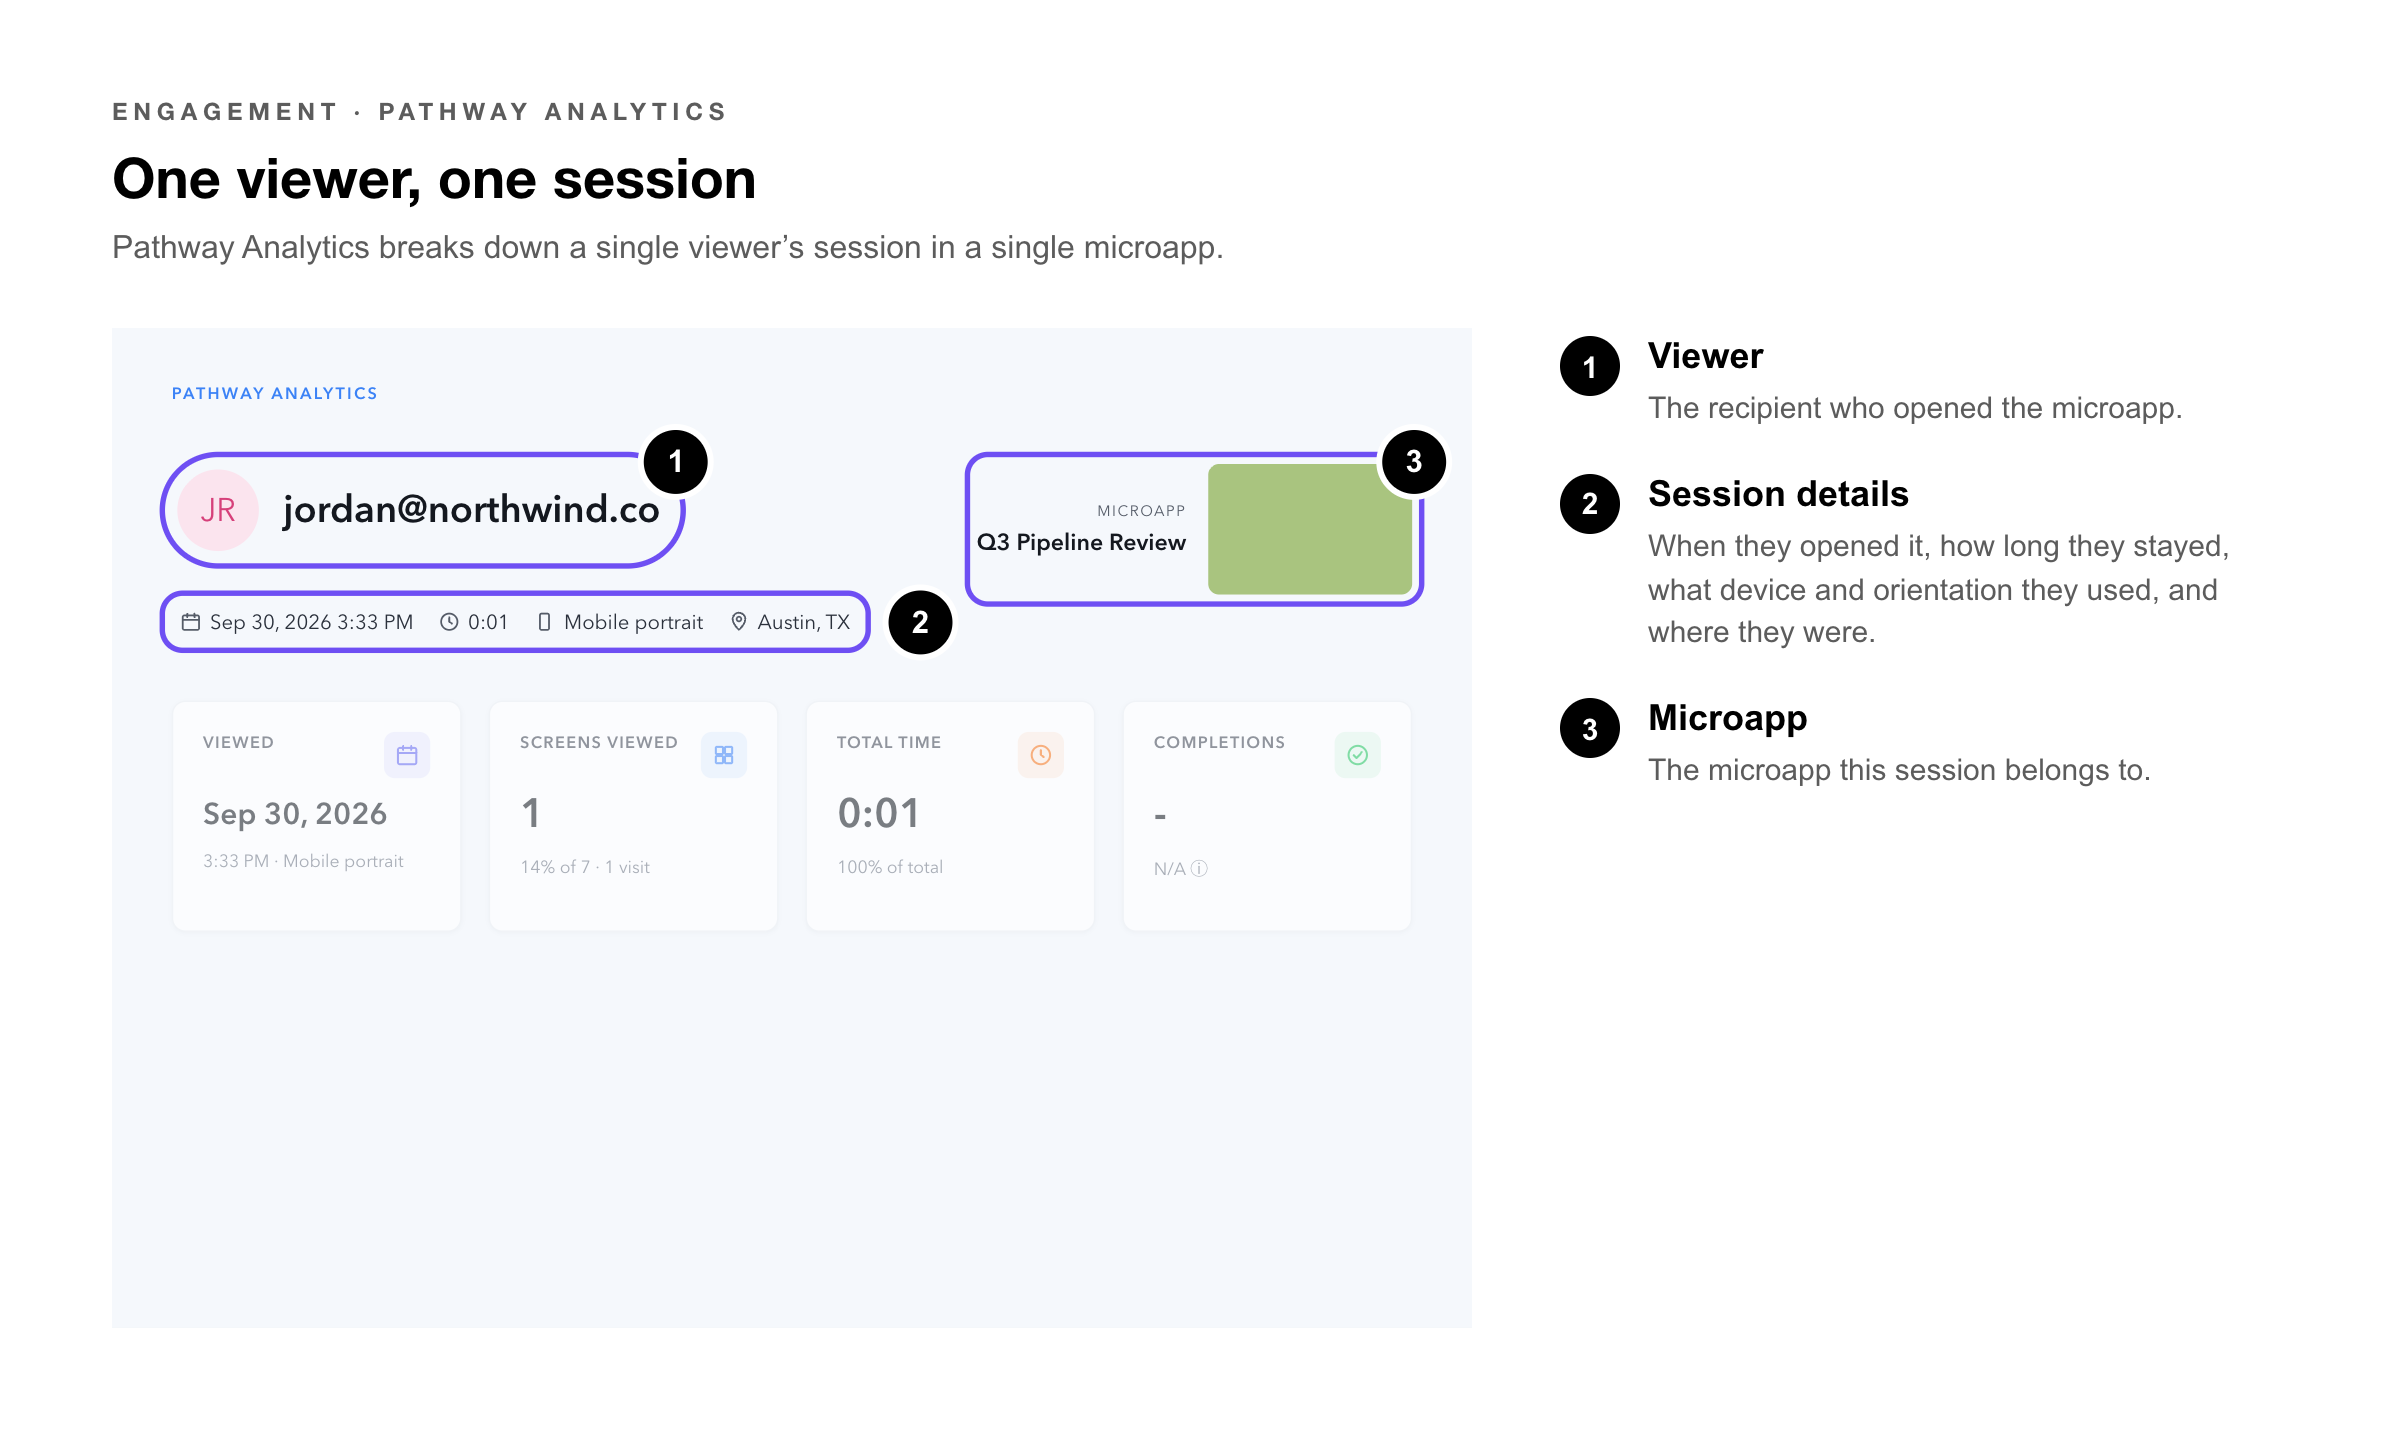 Pathway Analytics follows a single viewer through a microapp shared with a Direct Share link. The page is organized into five areas:
|
Area |
What It Shows |
|
Viewer and session |
Who viewed the microapp, when, for how long, on what kind of device and orientation, and from what location — alongside the microapp they viewed. |
|
Summary cards |
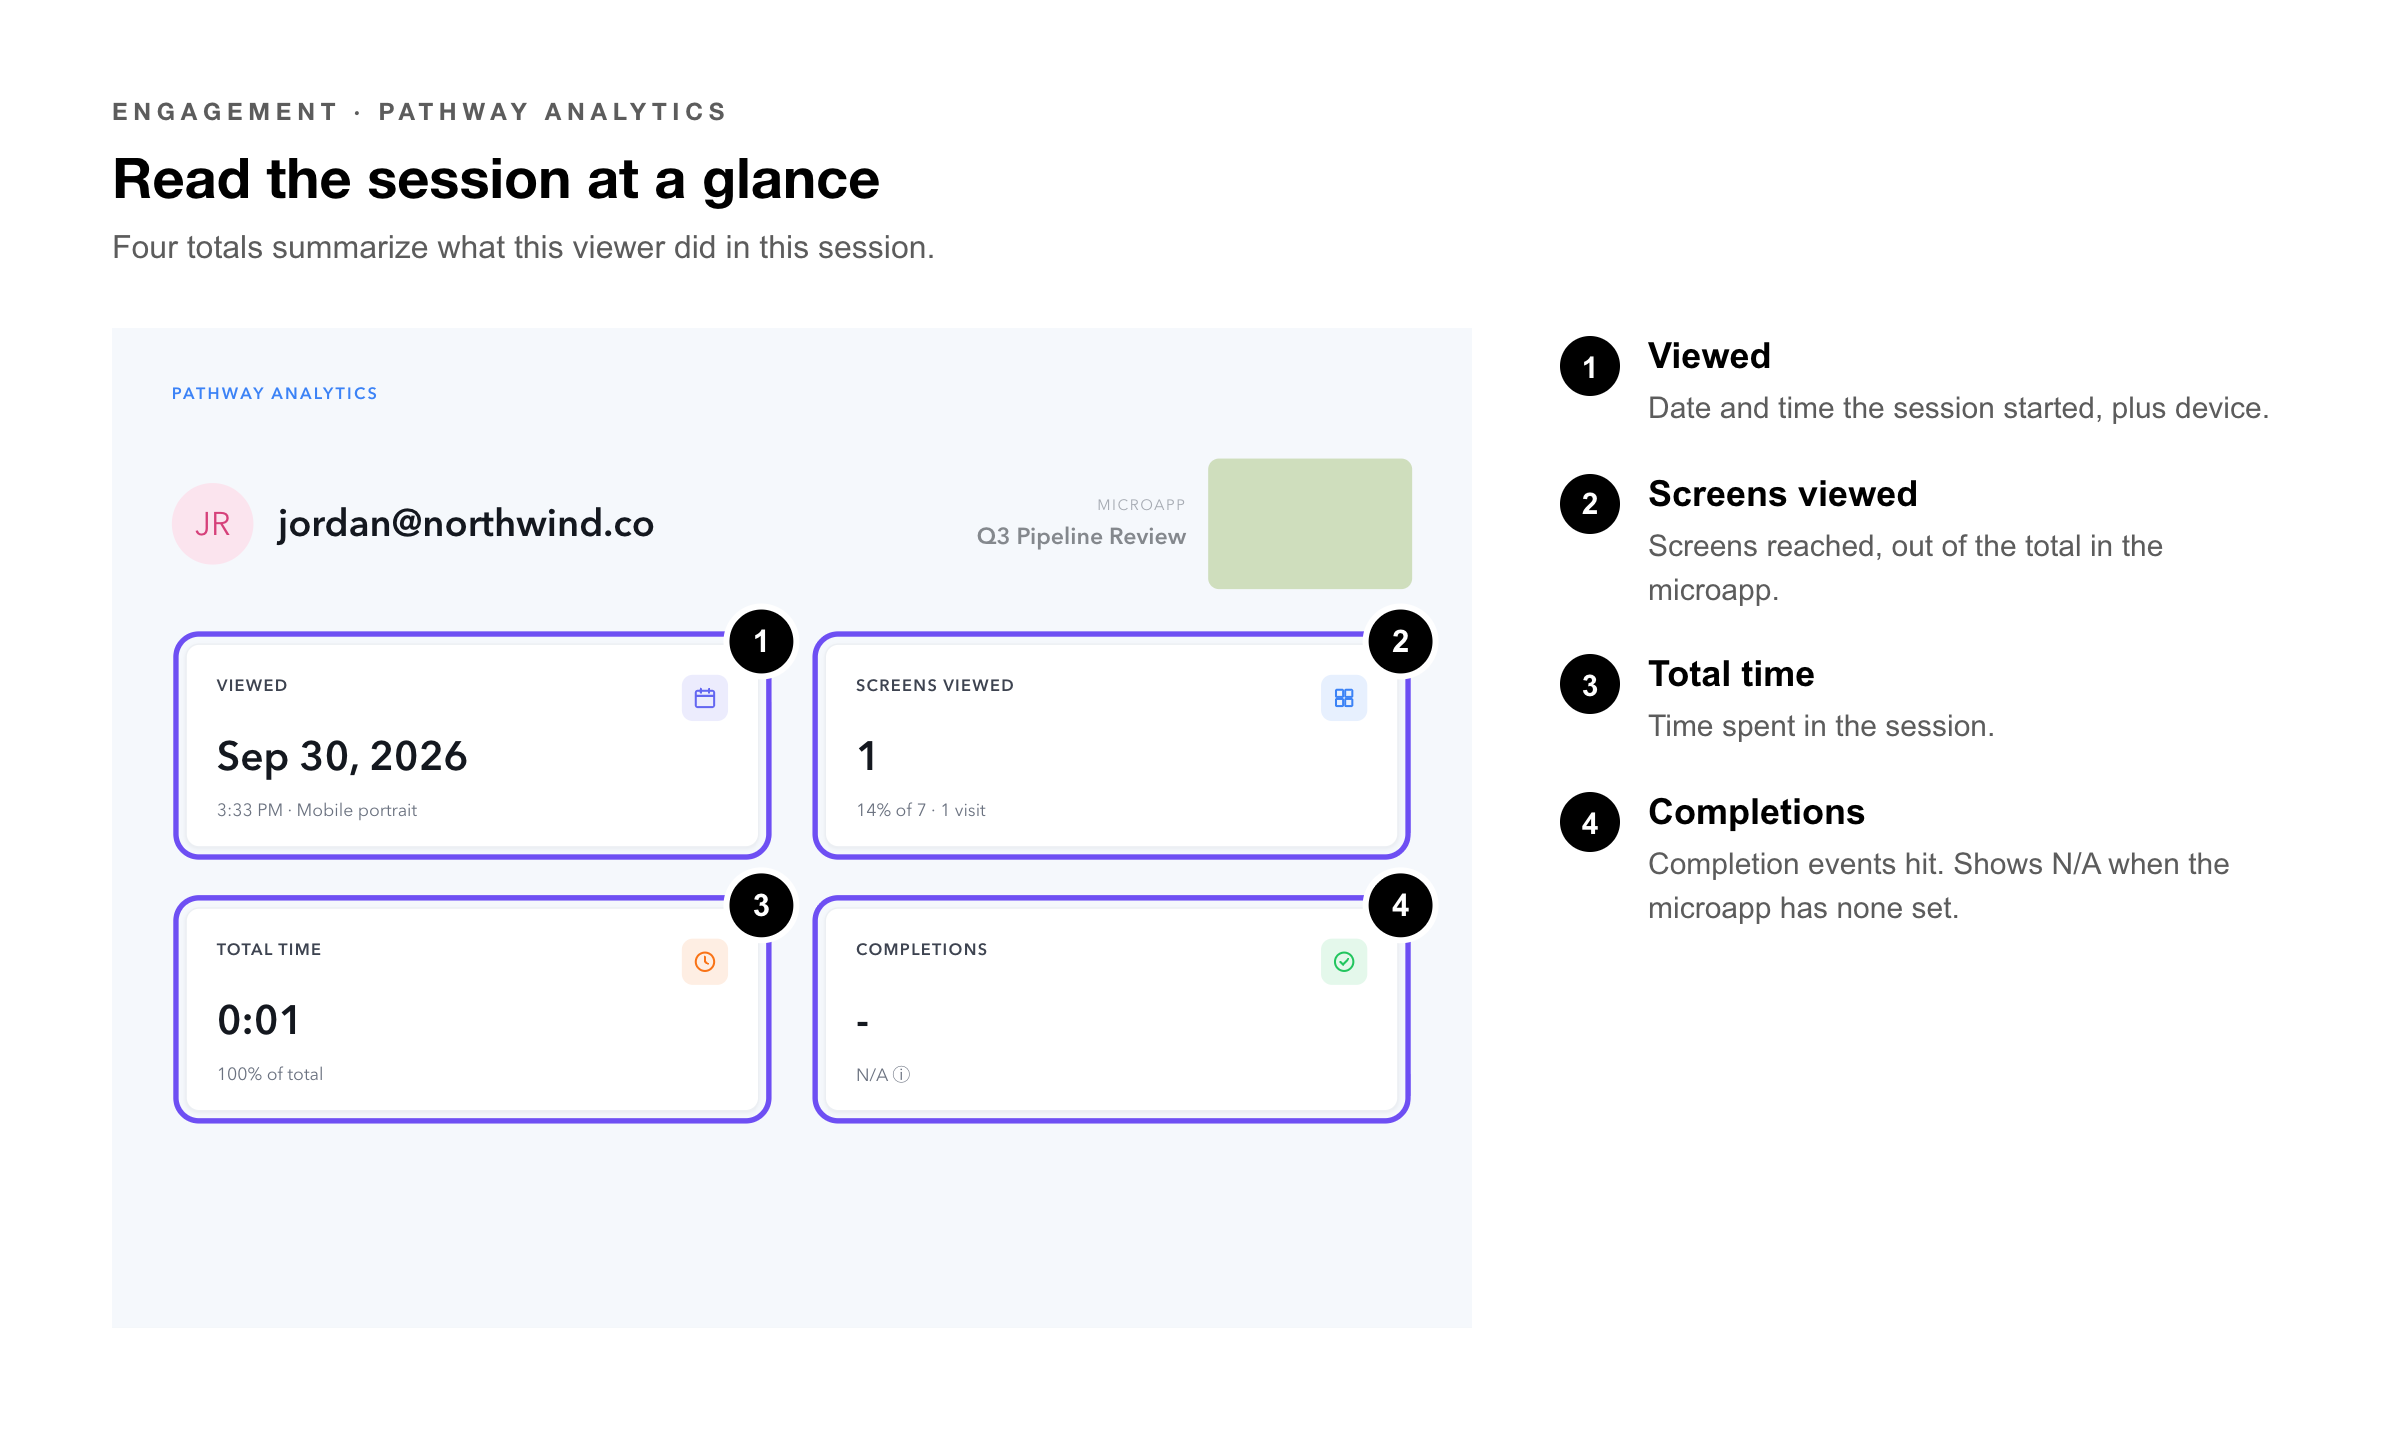
Viewed (date and device), Screens Viewed (how many screens, and what share of the microapp), Total Time, and Completions (completion events reached). |
|
Screens Summary |
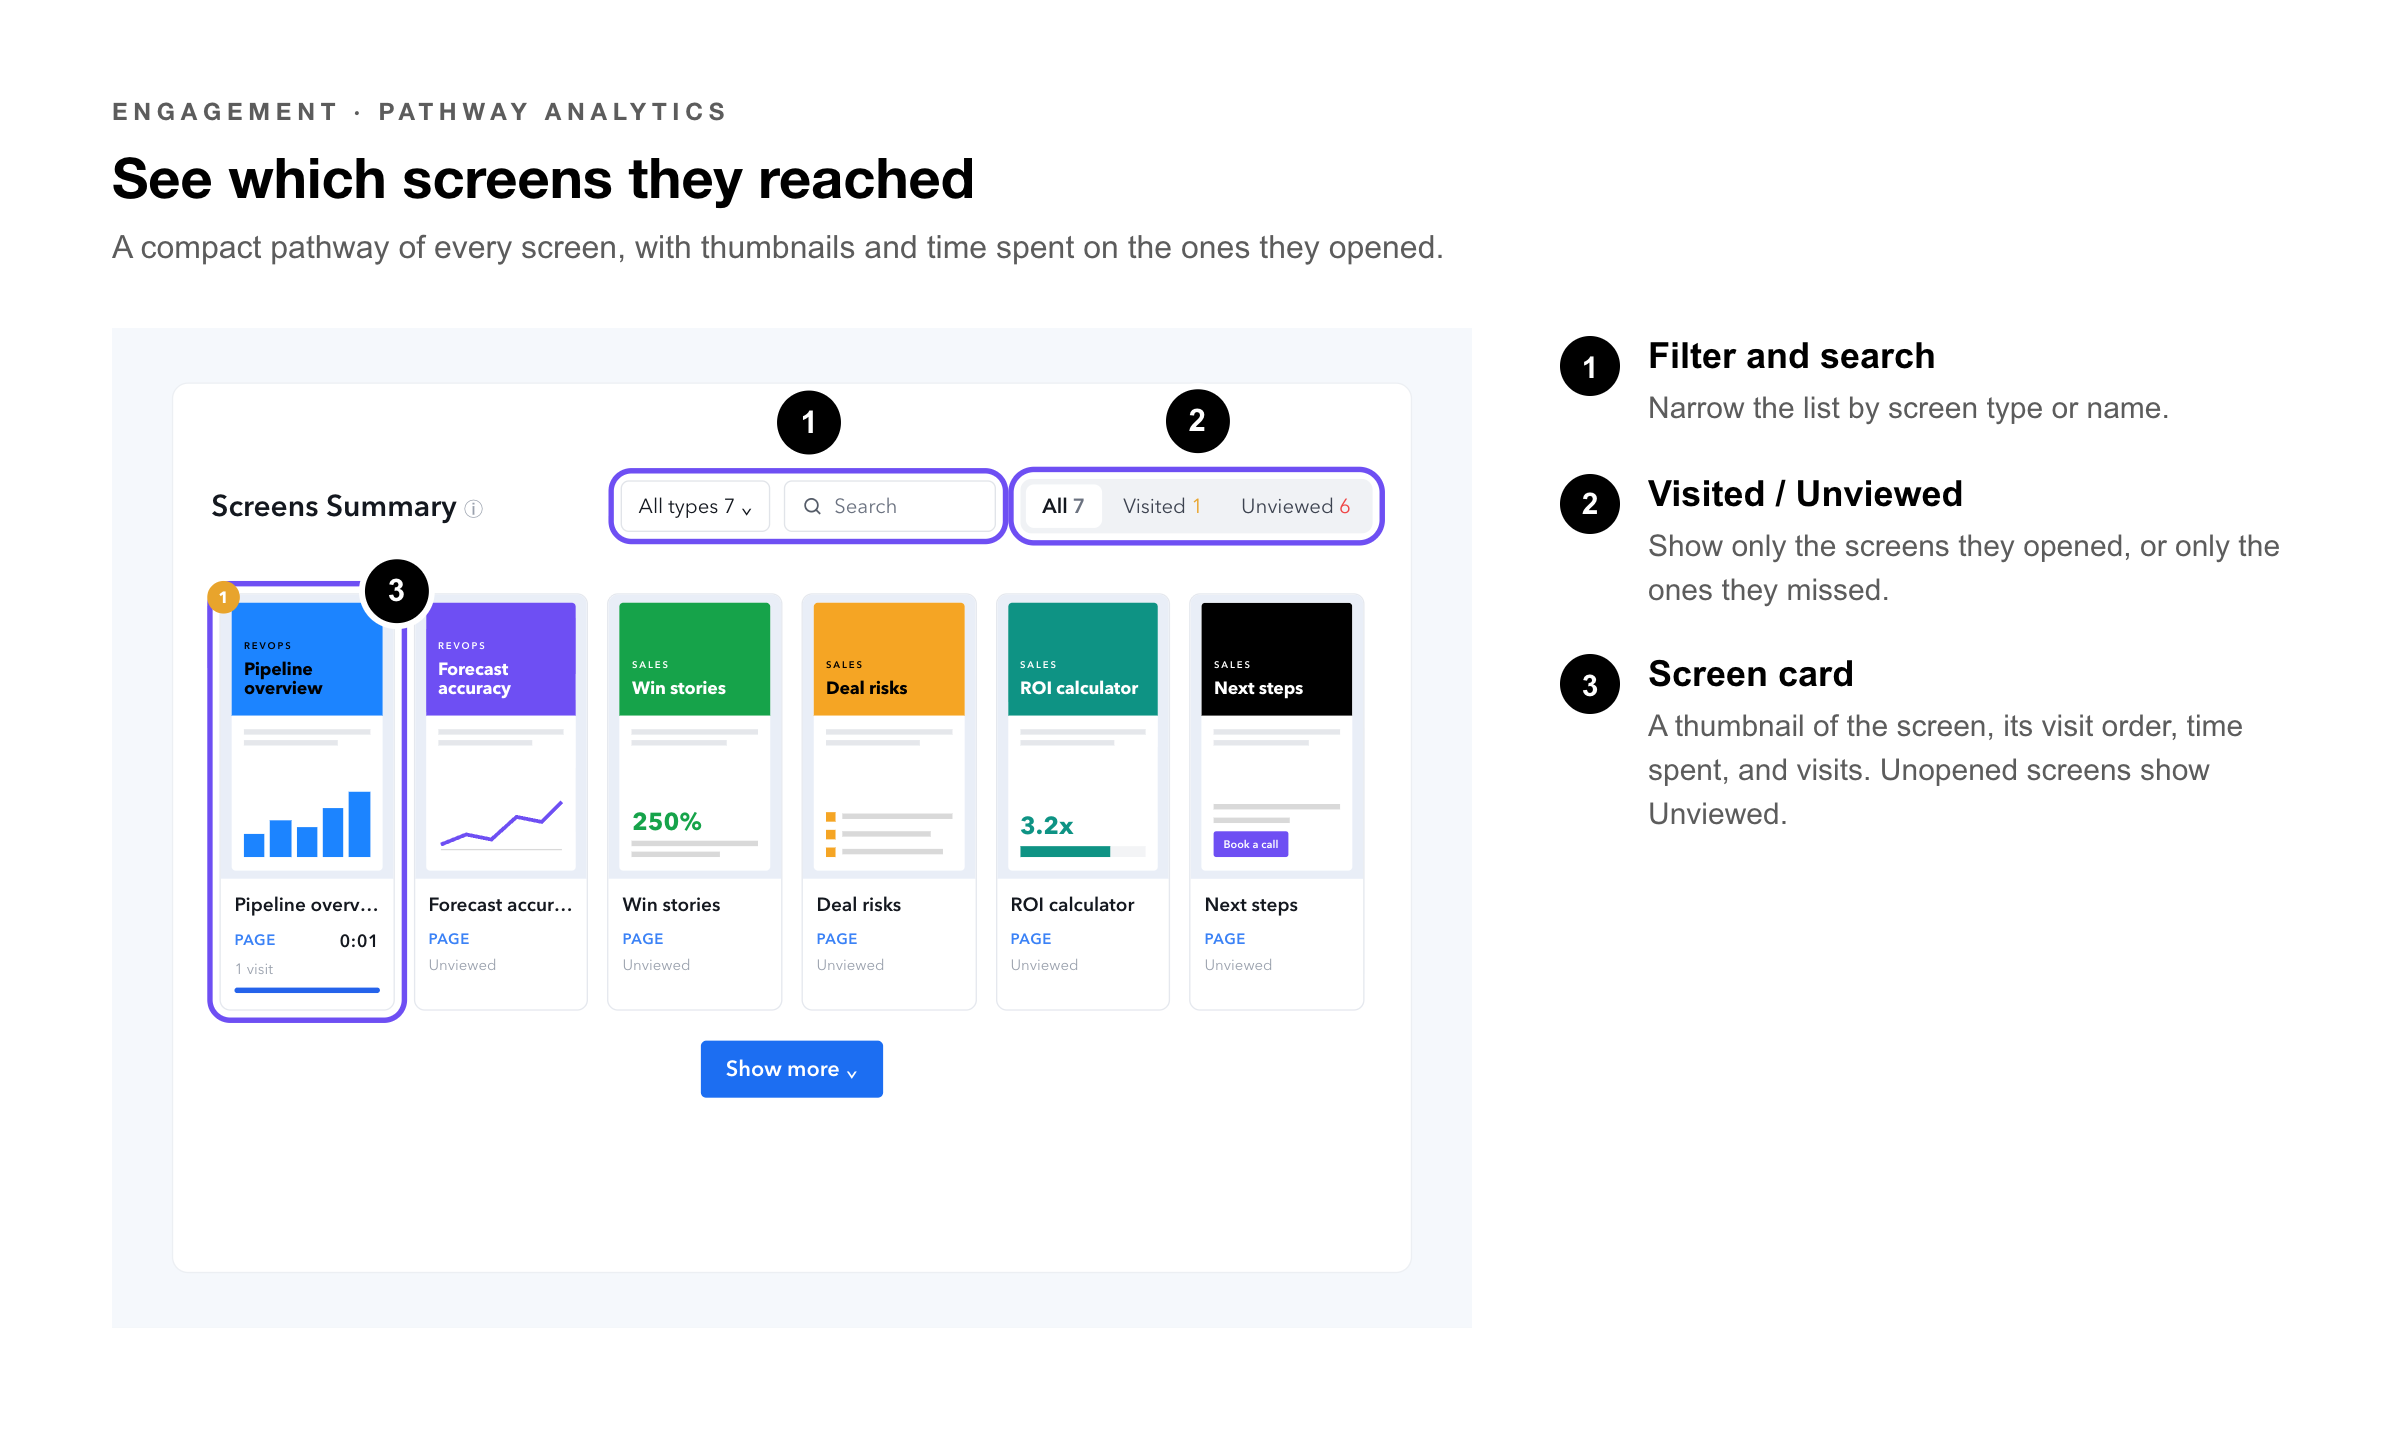
A thumbnail of every screen in the microapp, each showing its type, the time spent on it, and its visits — or marked Unviewed. |
|
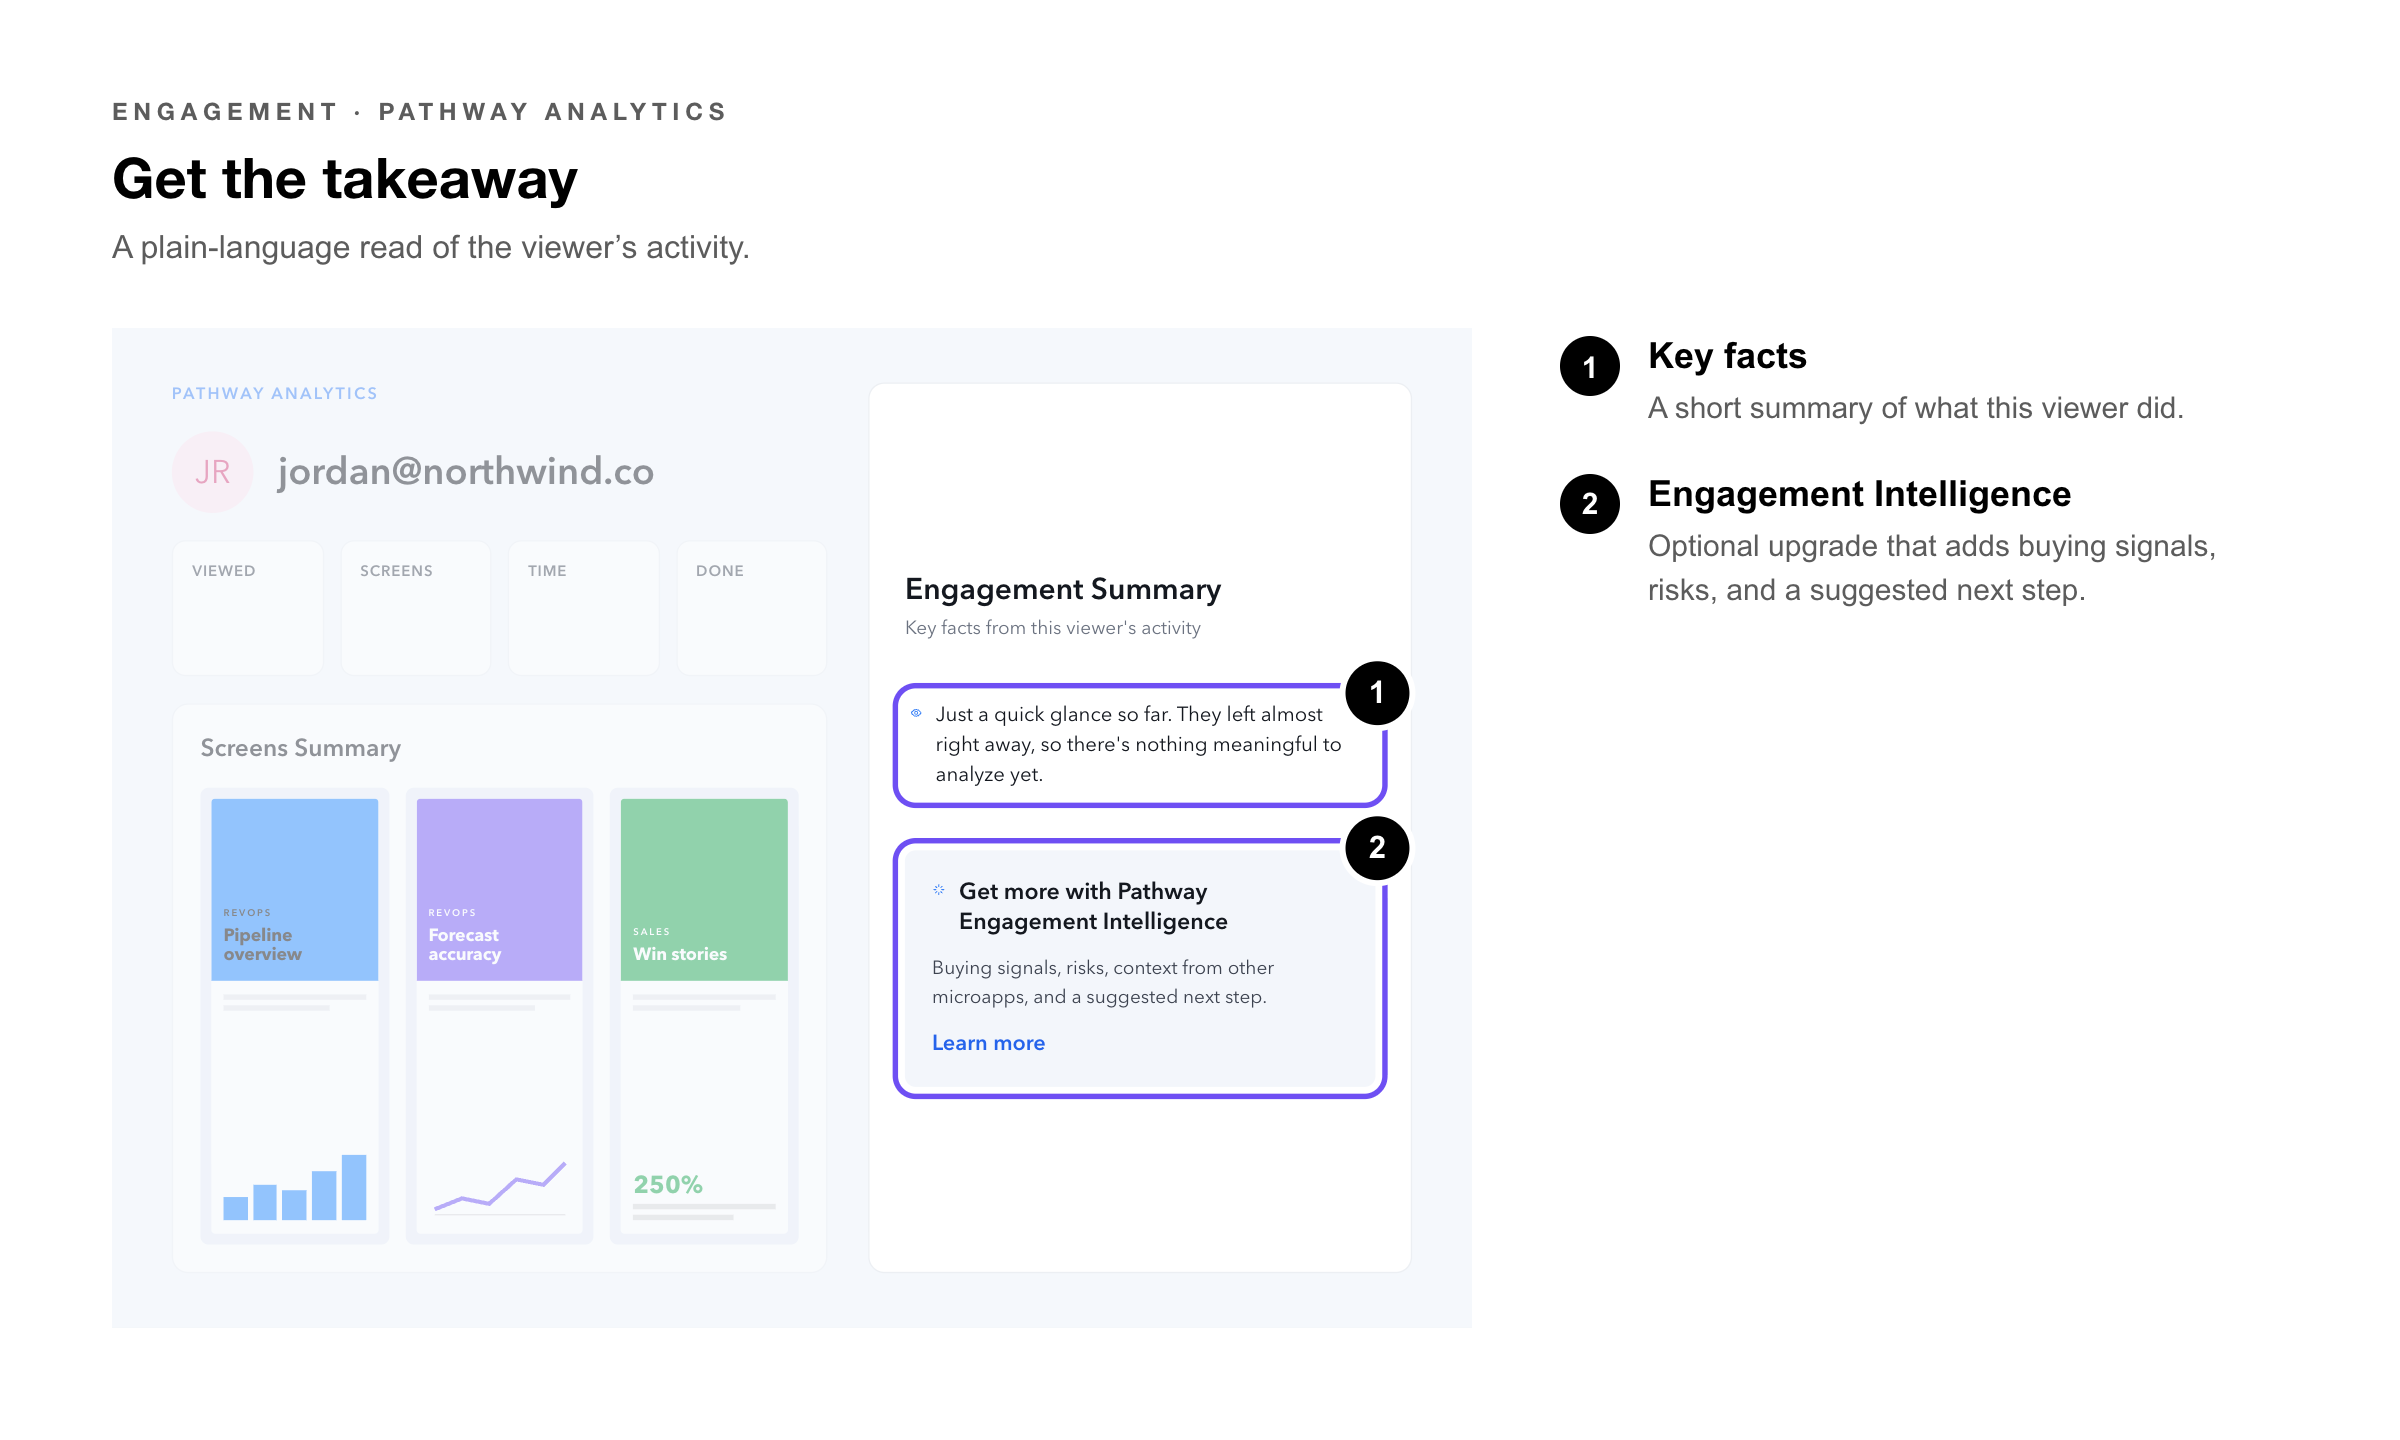
Engagement Summary |
A short written summary of key facts from this viewer’s activity. |
|
Session Pathway |
How the viewer moved through the microapp in a single session. |
Using the Screens Summary
The Screens Summary is where most of the detail lives. You can narrow it down in three ways:
• All, Visited, or Unviewed — show every screen, only those the viewer reached, or only those they never saw. Each option shows a count.
• Screen type — filter to one kind of screen, such as pages.
• Search — find a screen by name.
Long microapps show the first set of screens; select Show more to see the rest.
|
Pro Tip: Switch to Unviewed before a follow-up. The screens a recipient never reached are often the ones worth walking them through — especially if a completion event sits among them. |
Accessing Pathway Analytics
There are two ways in:
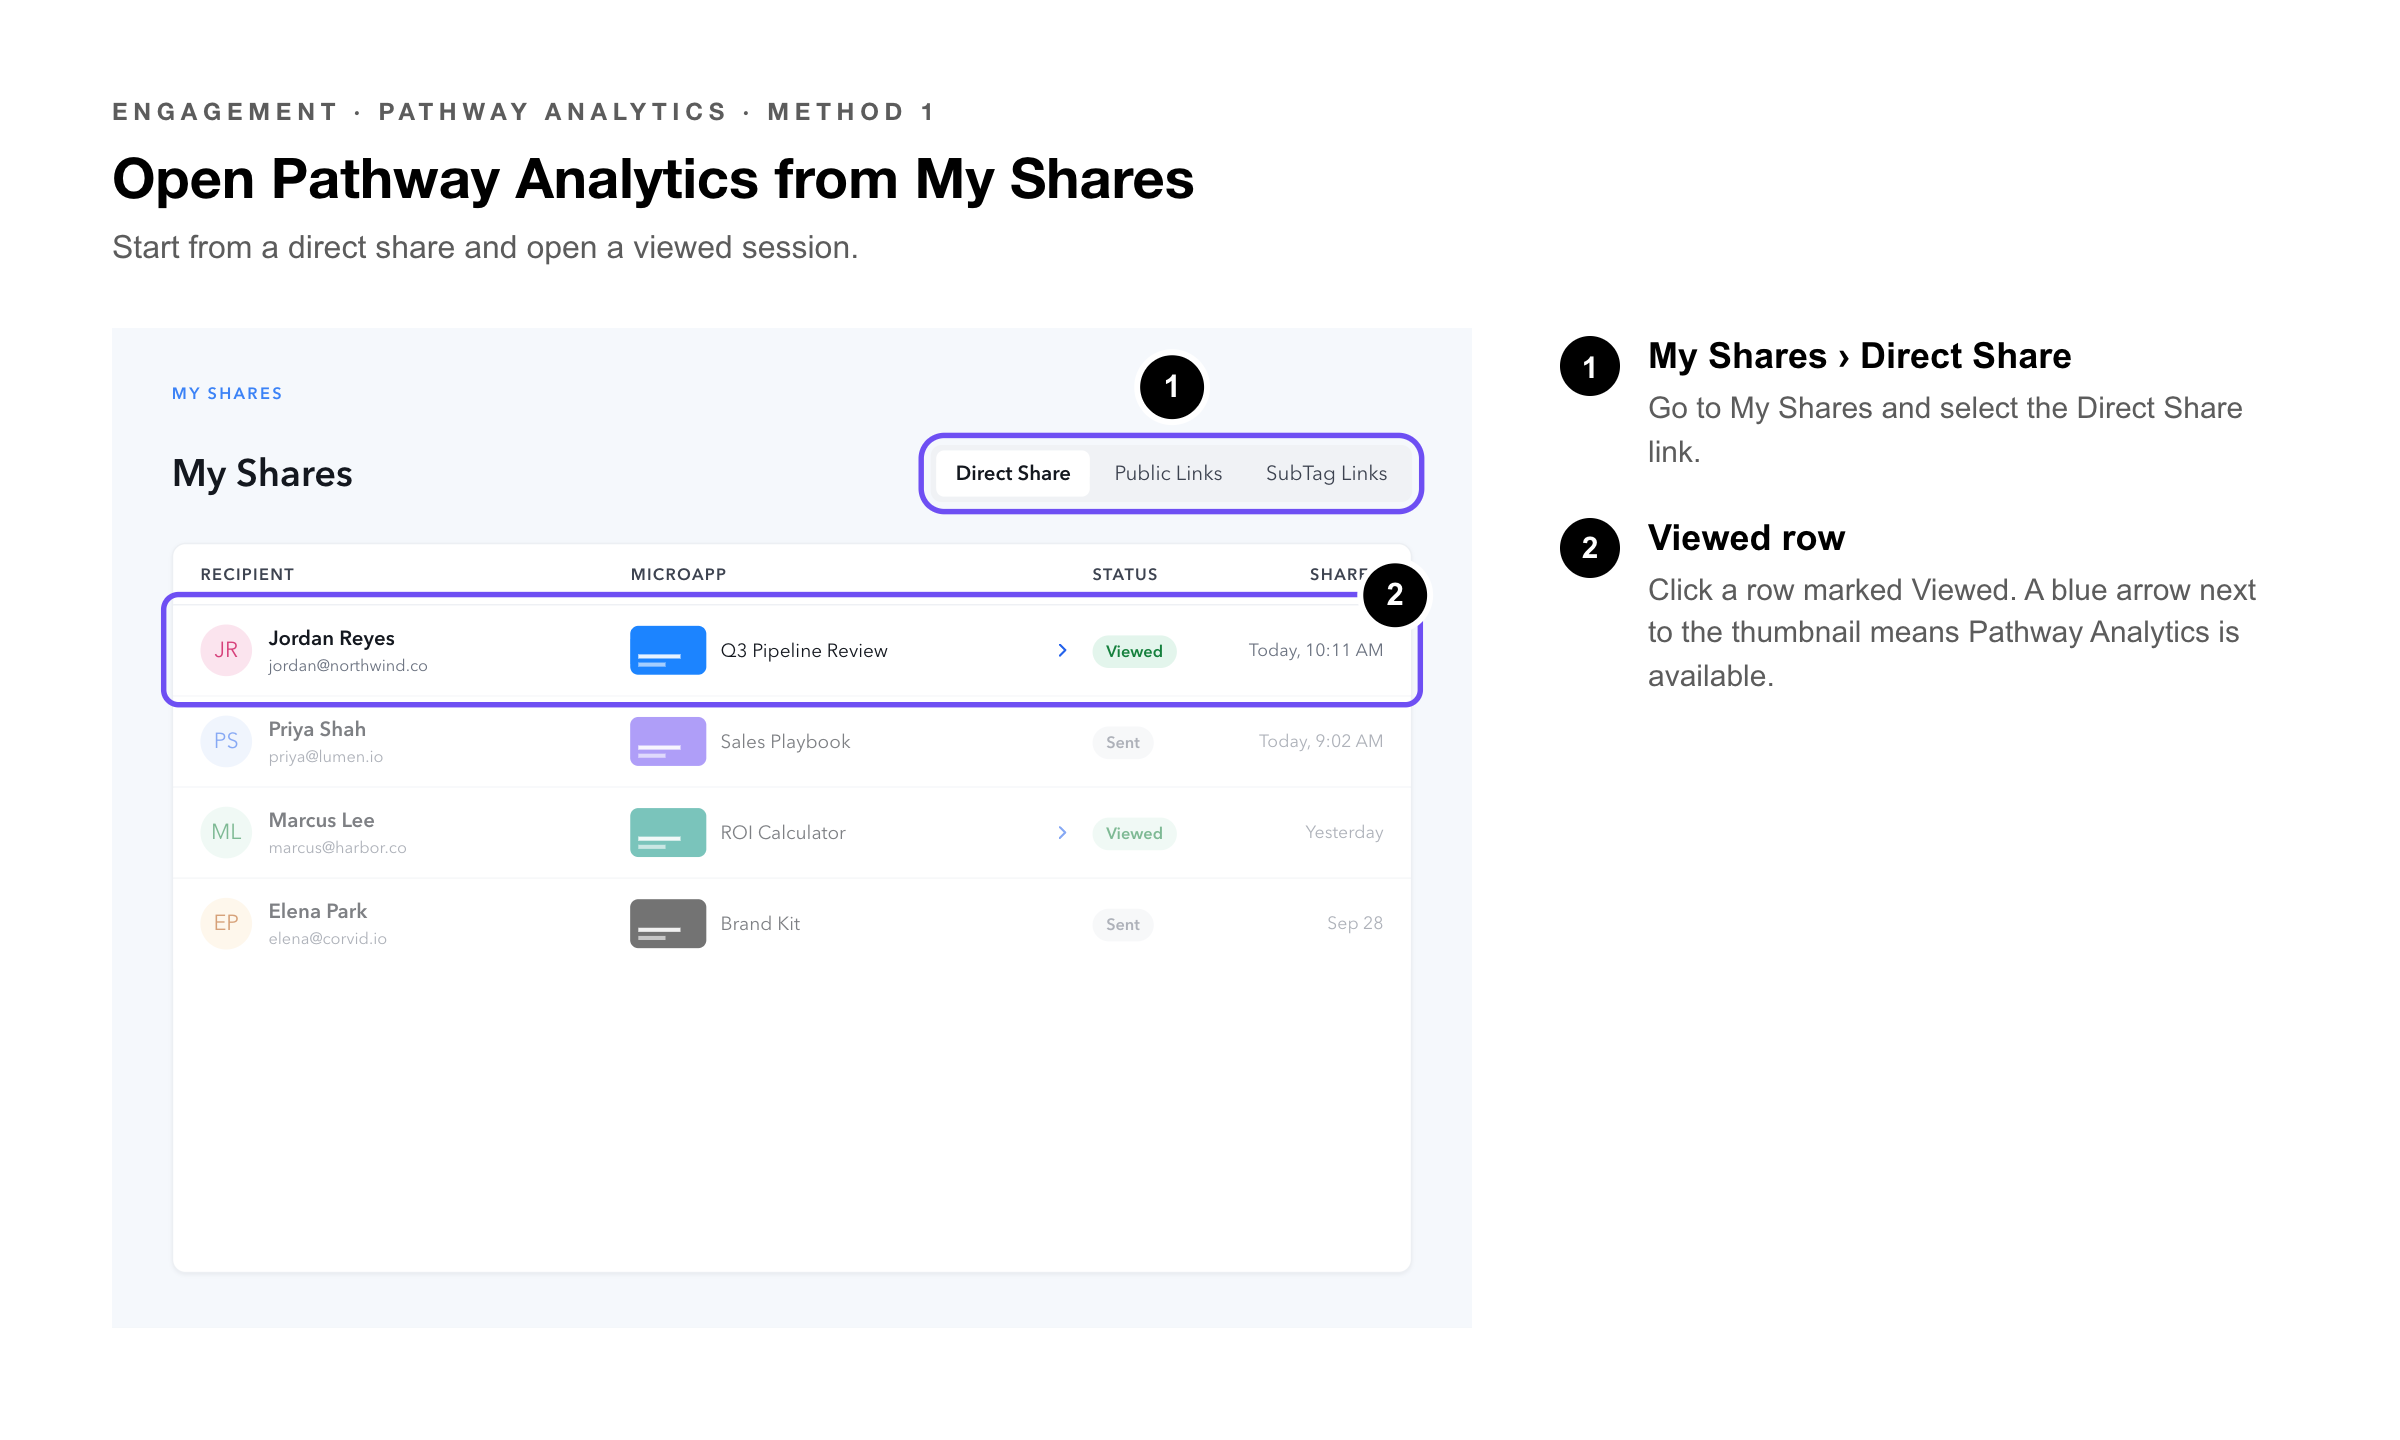
• From My Shares — select a Direct Share link, then select the row where the microapp shows as Viewed.
• From Engagement — find the user under Latest User Activity and select an item from their recent activity.
|
Heads Up: You can only see Pathway Analytics for Direct Share links you created yourself. Links generated by other users on your account aren’t available to you. |
Method 1
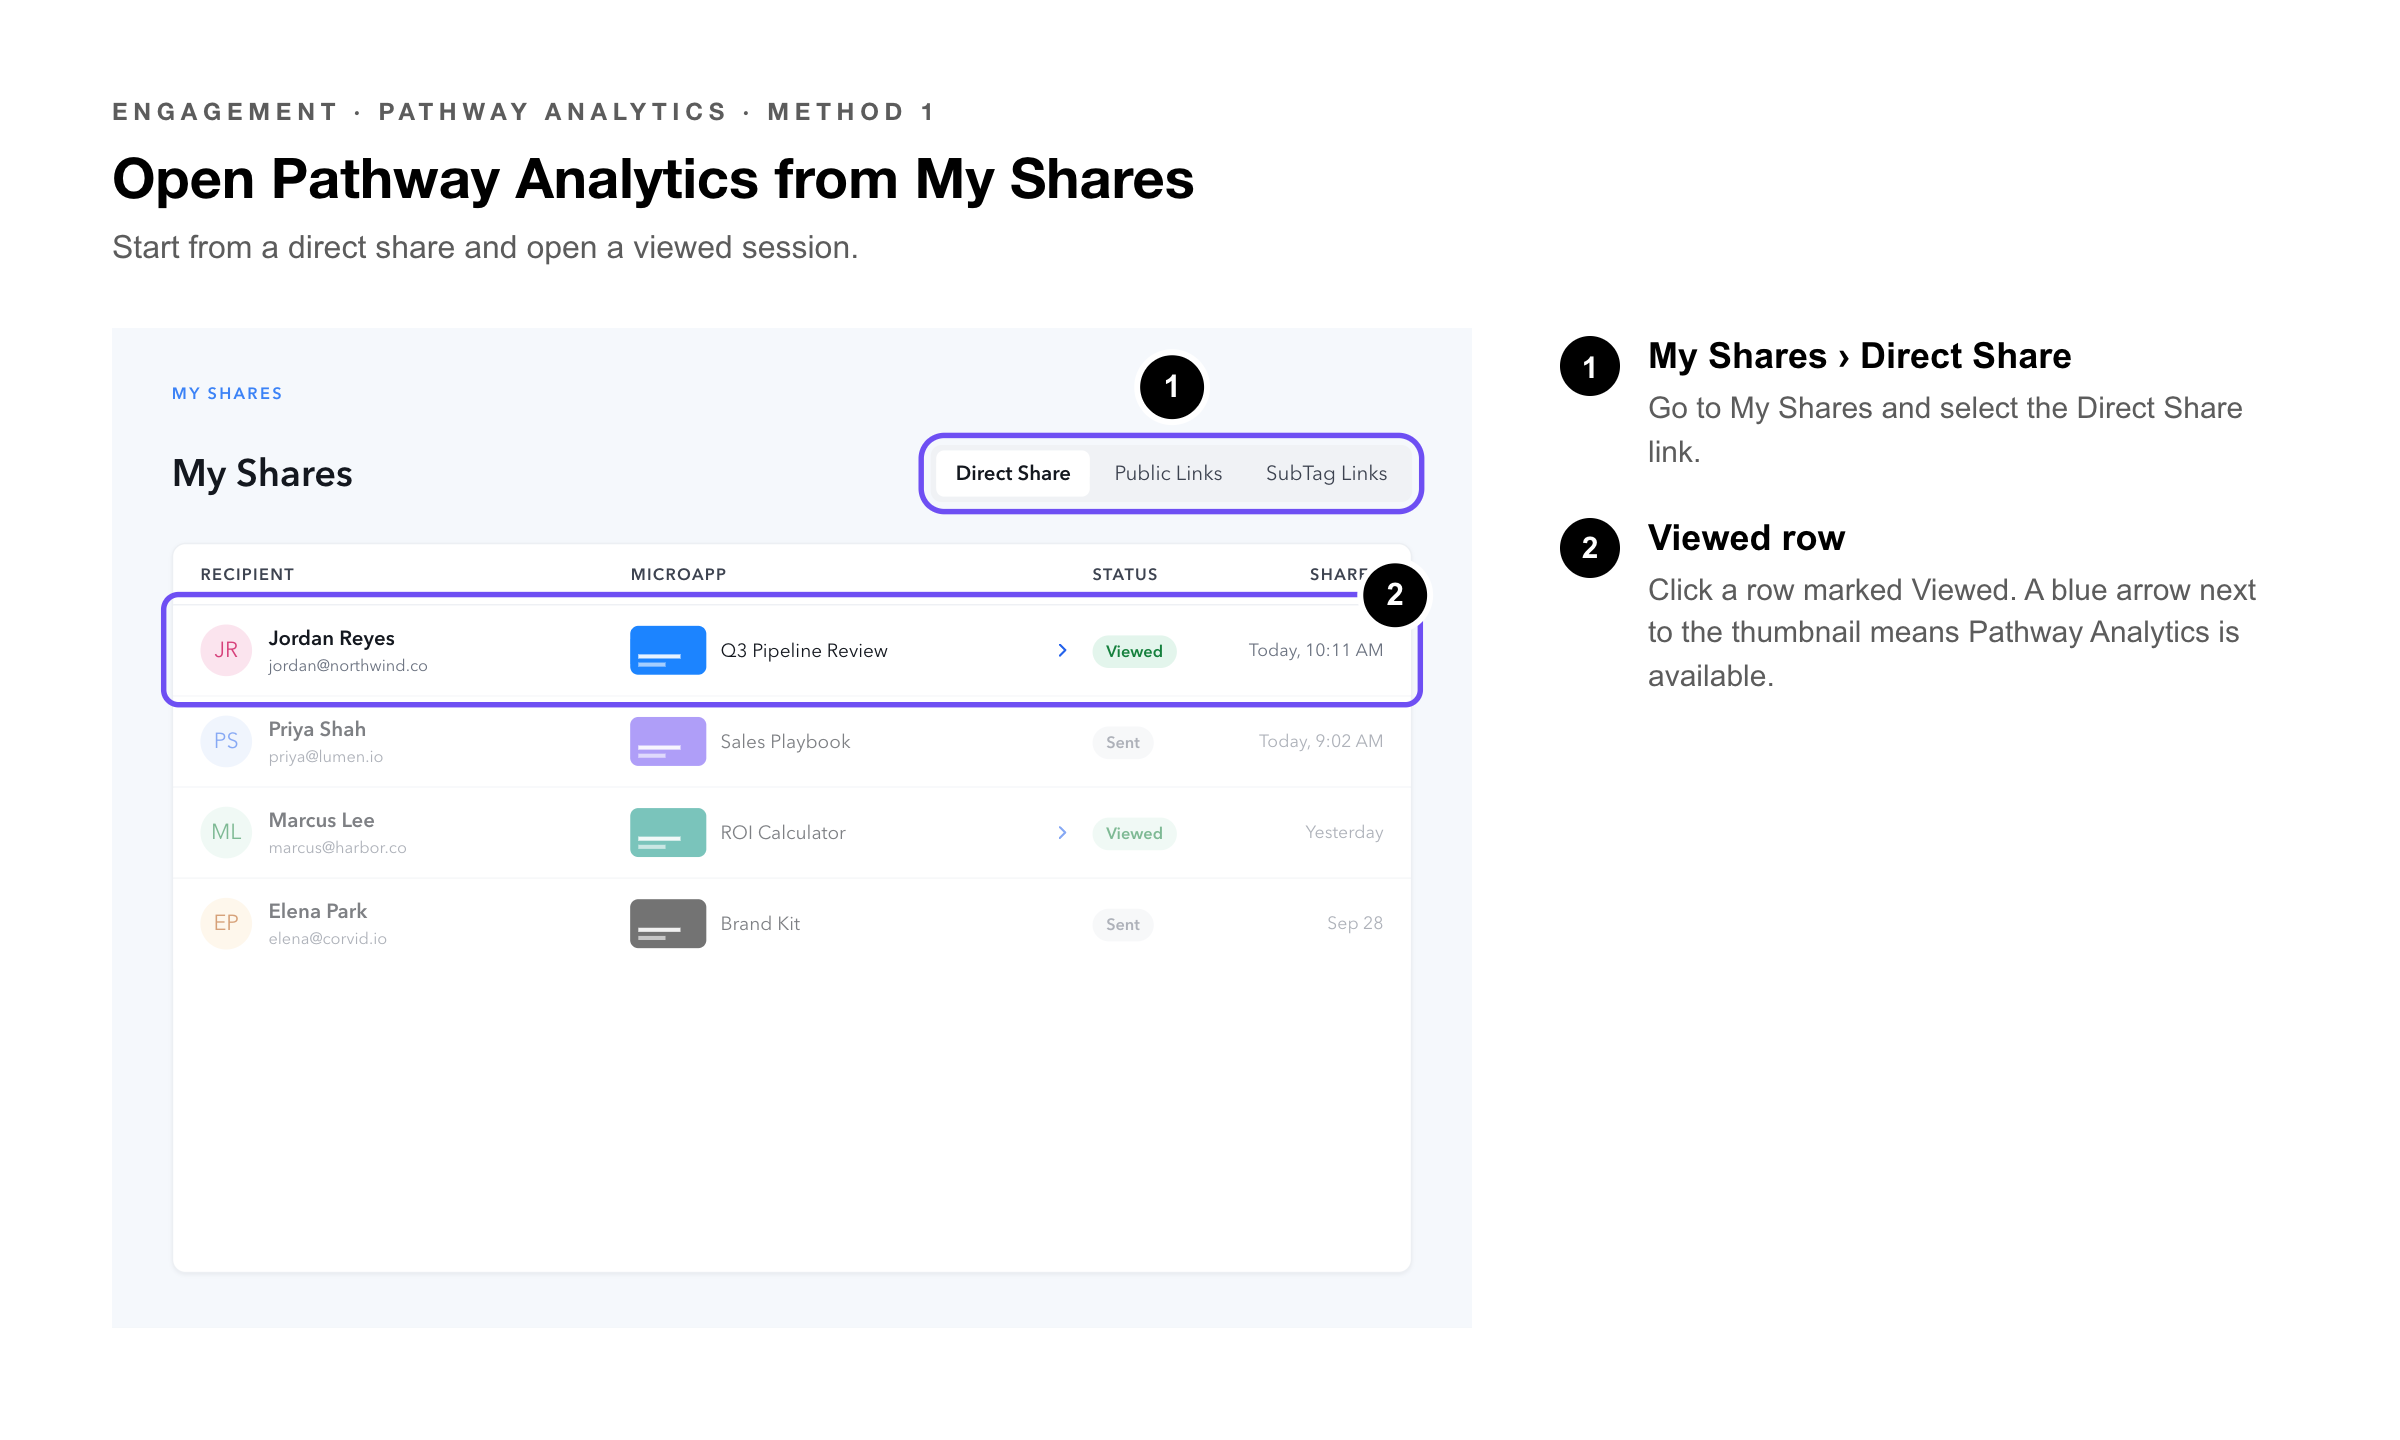
- Navigate to My Shares.
- Select the Direct Share link.
- Click the row where the microapp has been "Viewed". Microapp thumbnails that have an arrow next to them indicate that pathway analytics are available for that microapp.
Method 2
- Navigate to Engagement.
- Under Latest User Activity identify the user who you want to analyze.
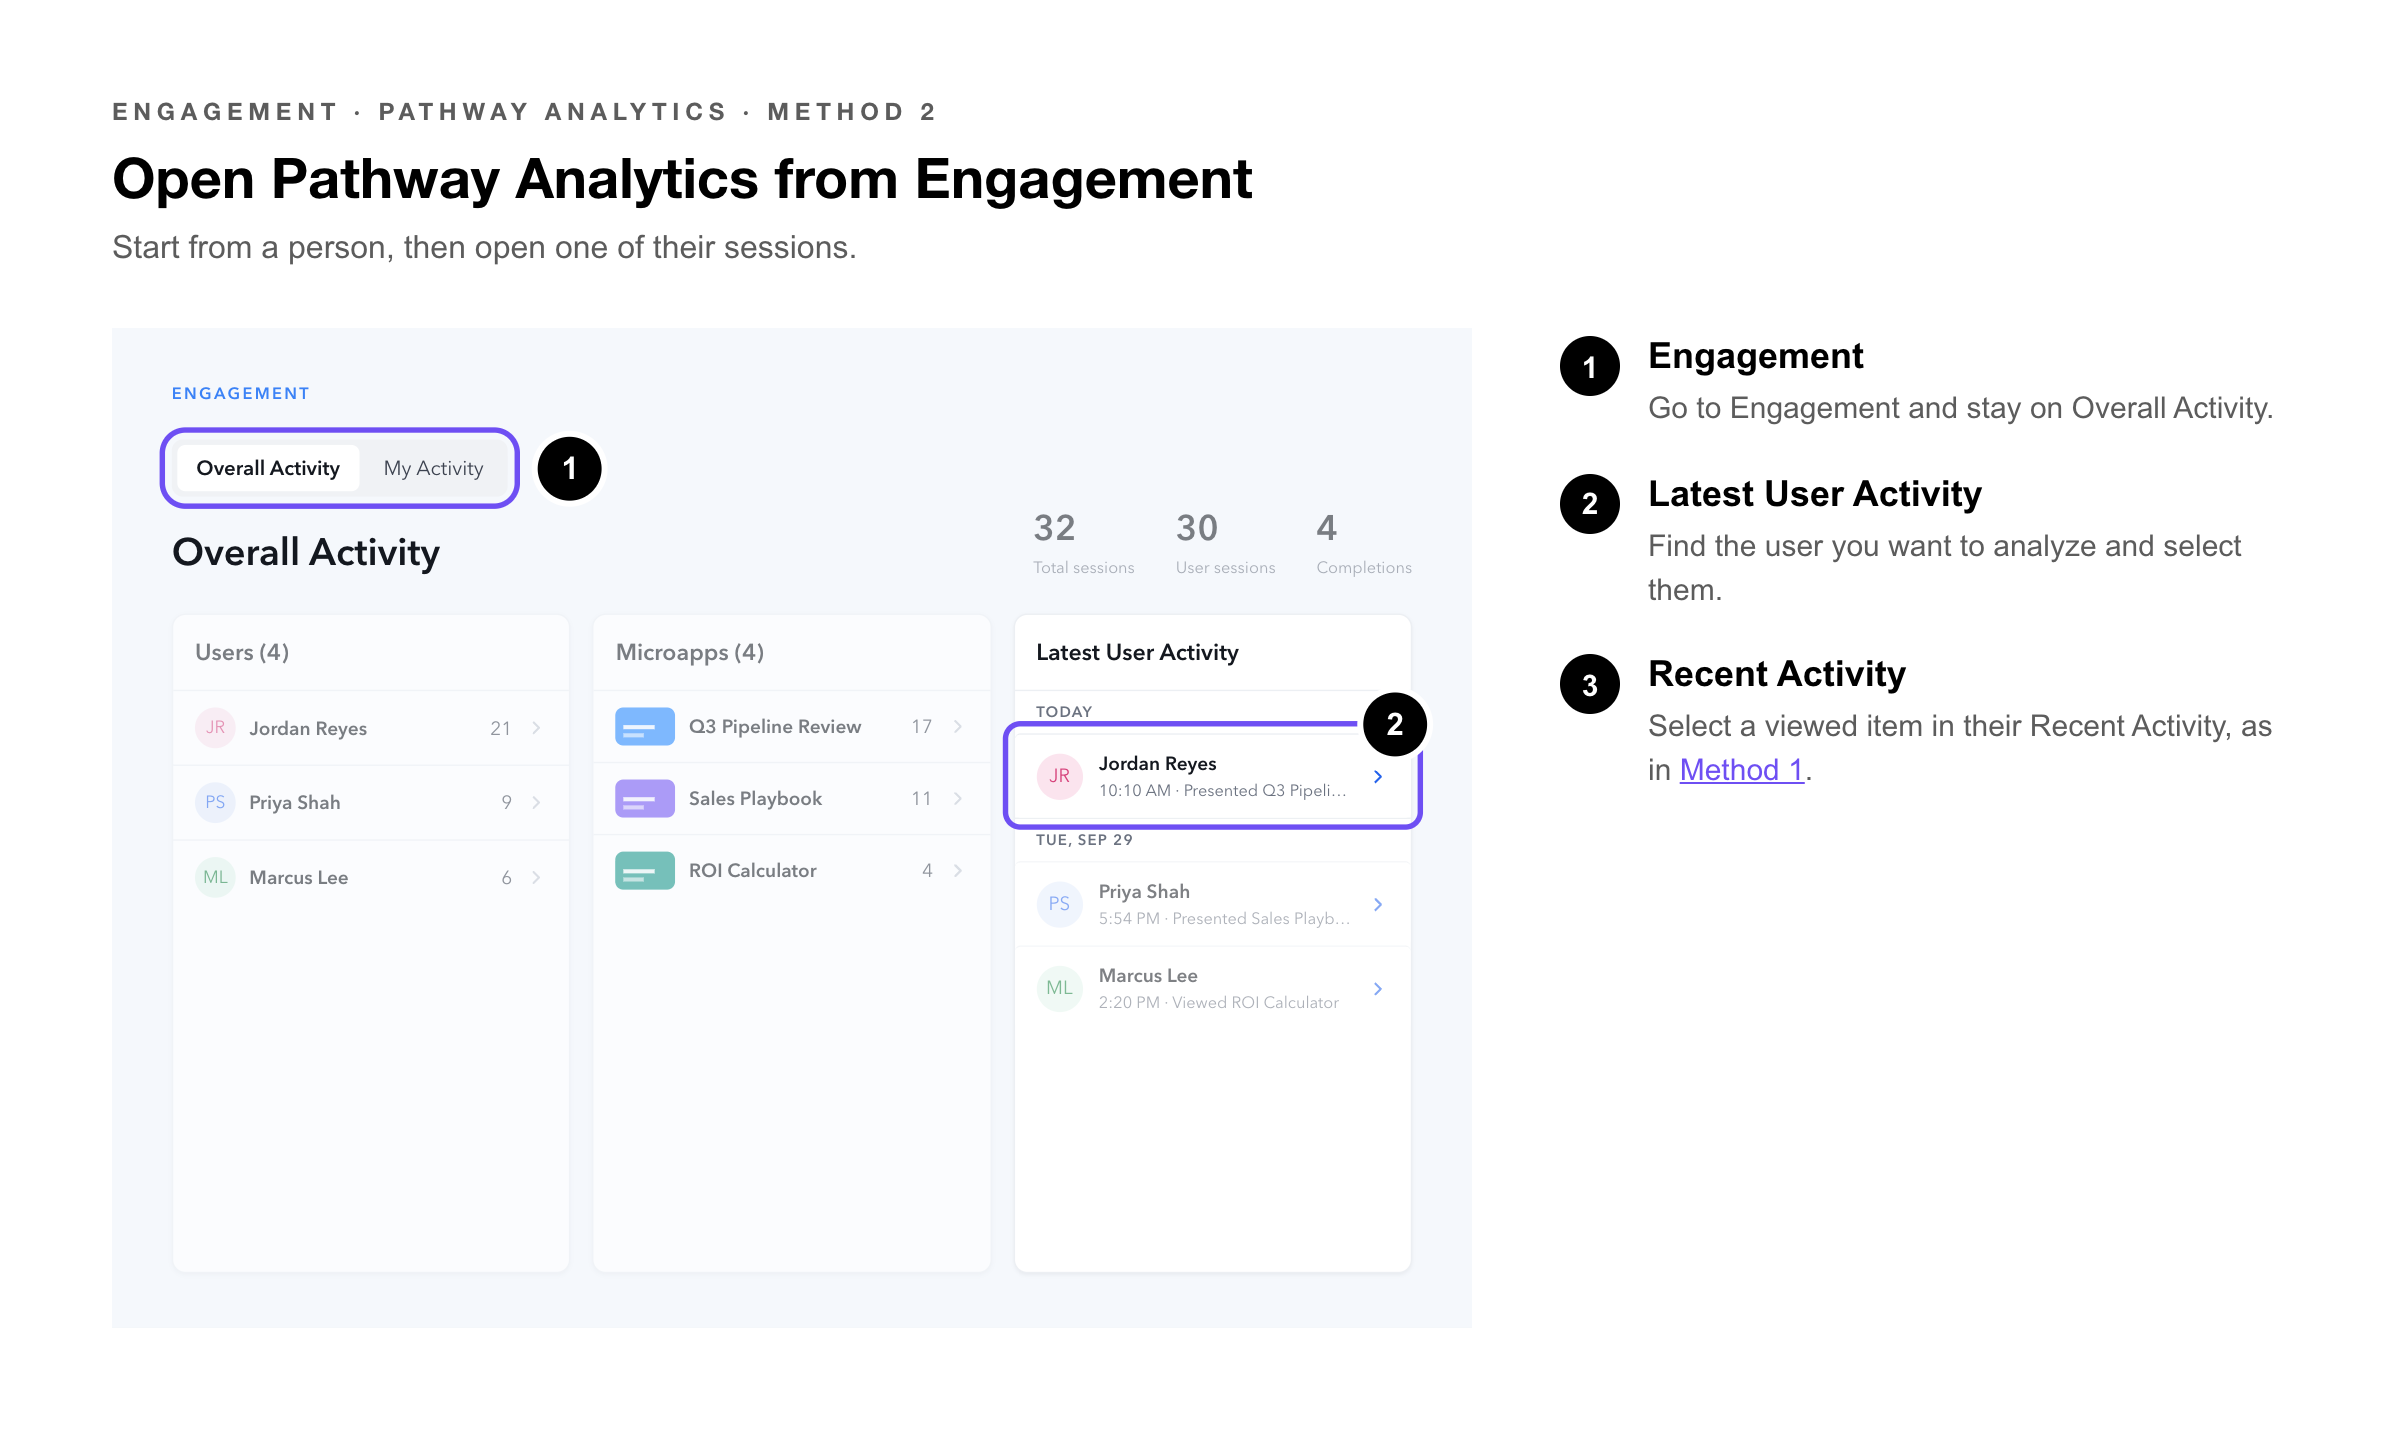
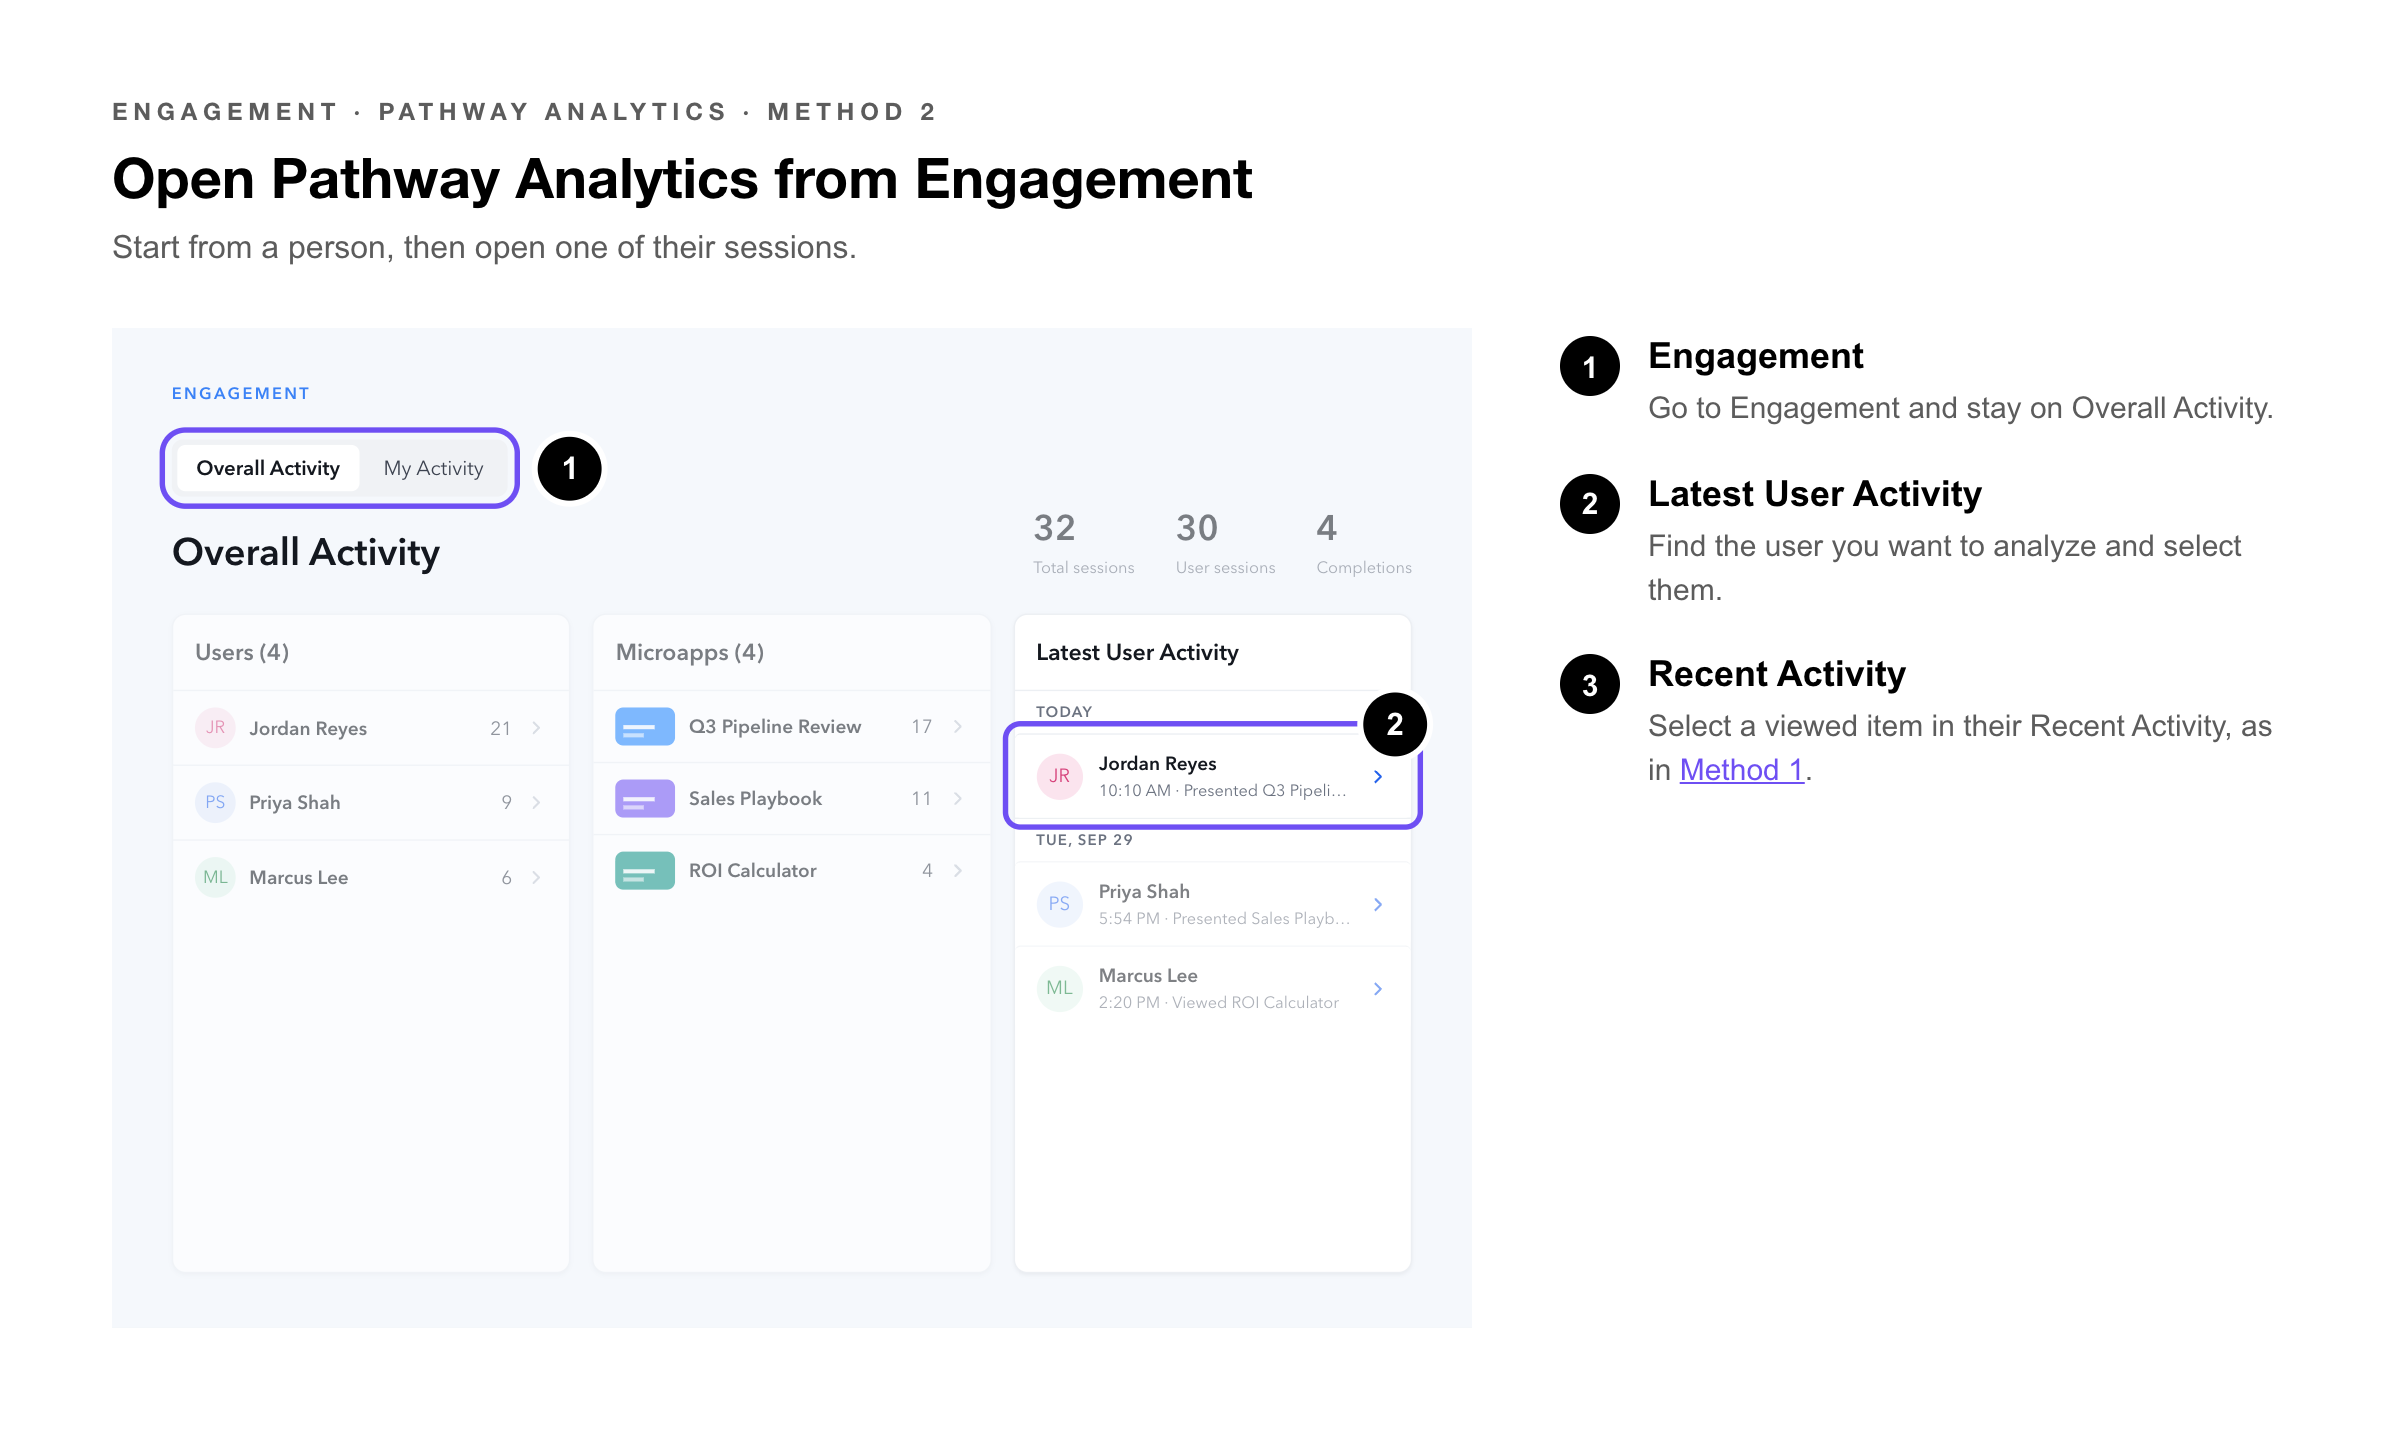
- Select an item that is apart of their Recent activity. (See Image in Method 1).
Understanding Pathway Analytics
A few signals are worth checking every time:
• Screens Viewed percentage — a low share means the viewer saw only a small part of the microapp. Check the Session Pathway for where they stopped.
• Time per screen — the screens holding the most time are usually the content that mattered most to this viewer.
• Visits per screen — a screen visited more than once is one the viewer came back to.
• Completions — whether the viewer reached the completion events you defined.
|
Pro Tip: Open Pathway Analytics before a follow-up call. Leading with the screen a recipient spent the most time on makes the conversation about what they cared about, not what you planned to say. |
|
Note: Interactions inside embedded content and iframes within a microapp aren’t tracked in Pathway Analytics (Embed Tile or Script Tile). |
| Section | Name | Description |
|---|---|---|
| 1 | Meta Data | Information pertaining to the Direct Share Link. Includes the microapp name, recipient, time of open and location of recipient. |
| 2 | Overview | Quick stats about the engagement of the Direct Send. Includes Number of microapp pages viewed, Number of Taps (or clicks) and total View Time. |
| 3 | Activity Timeline | A chronological list of activity within the shared microapp. Includes the microapp page name, duration of time on page and the microapp page thumbnail. |
| 4 | Activity Canvas | The microapp page canvas will show a blue bounding box for the hotspot links. Numbers with a light blue circle indicate the clicks on that microapp page. |
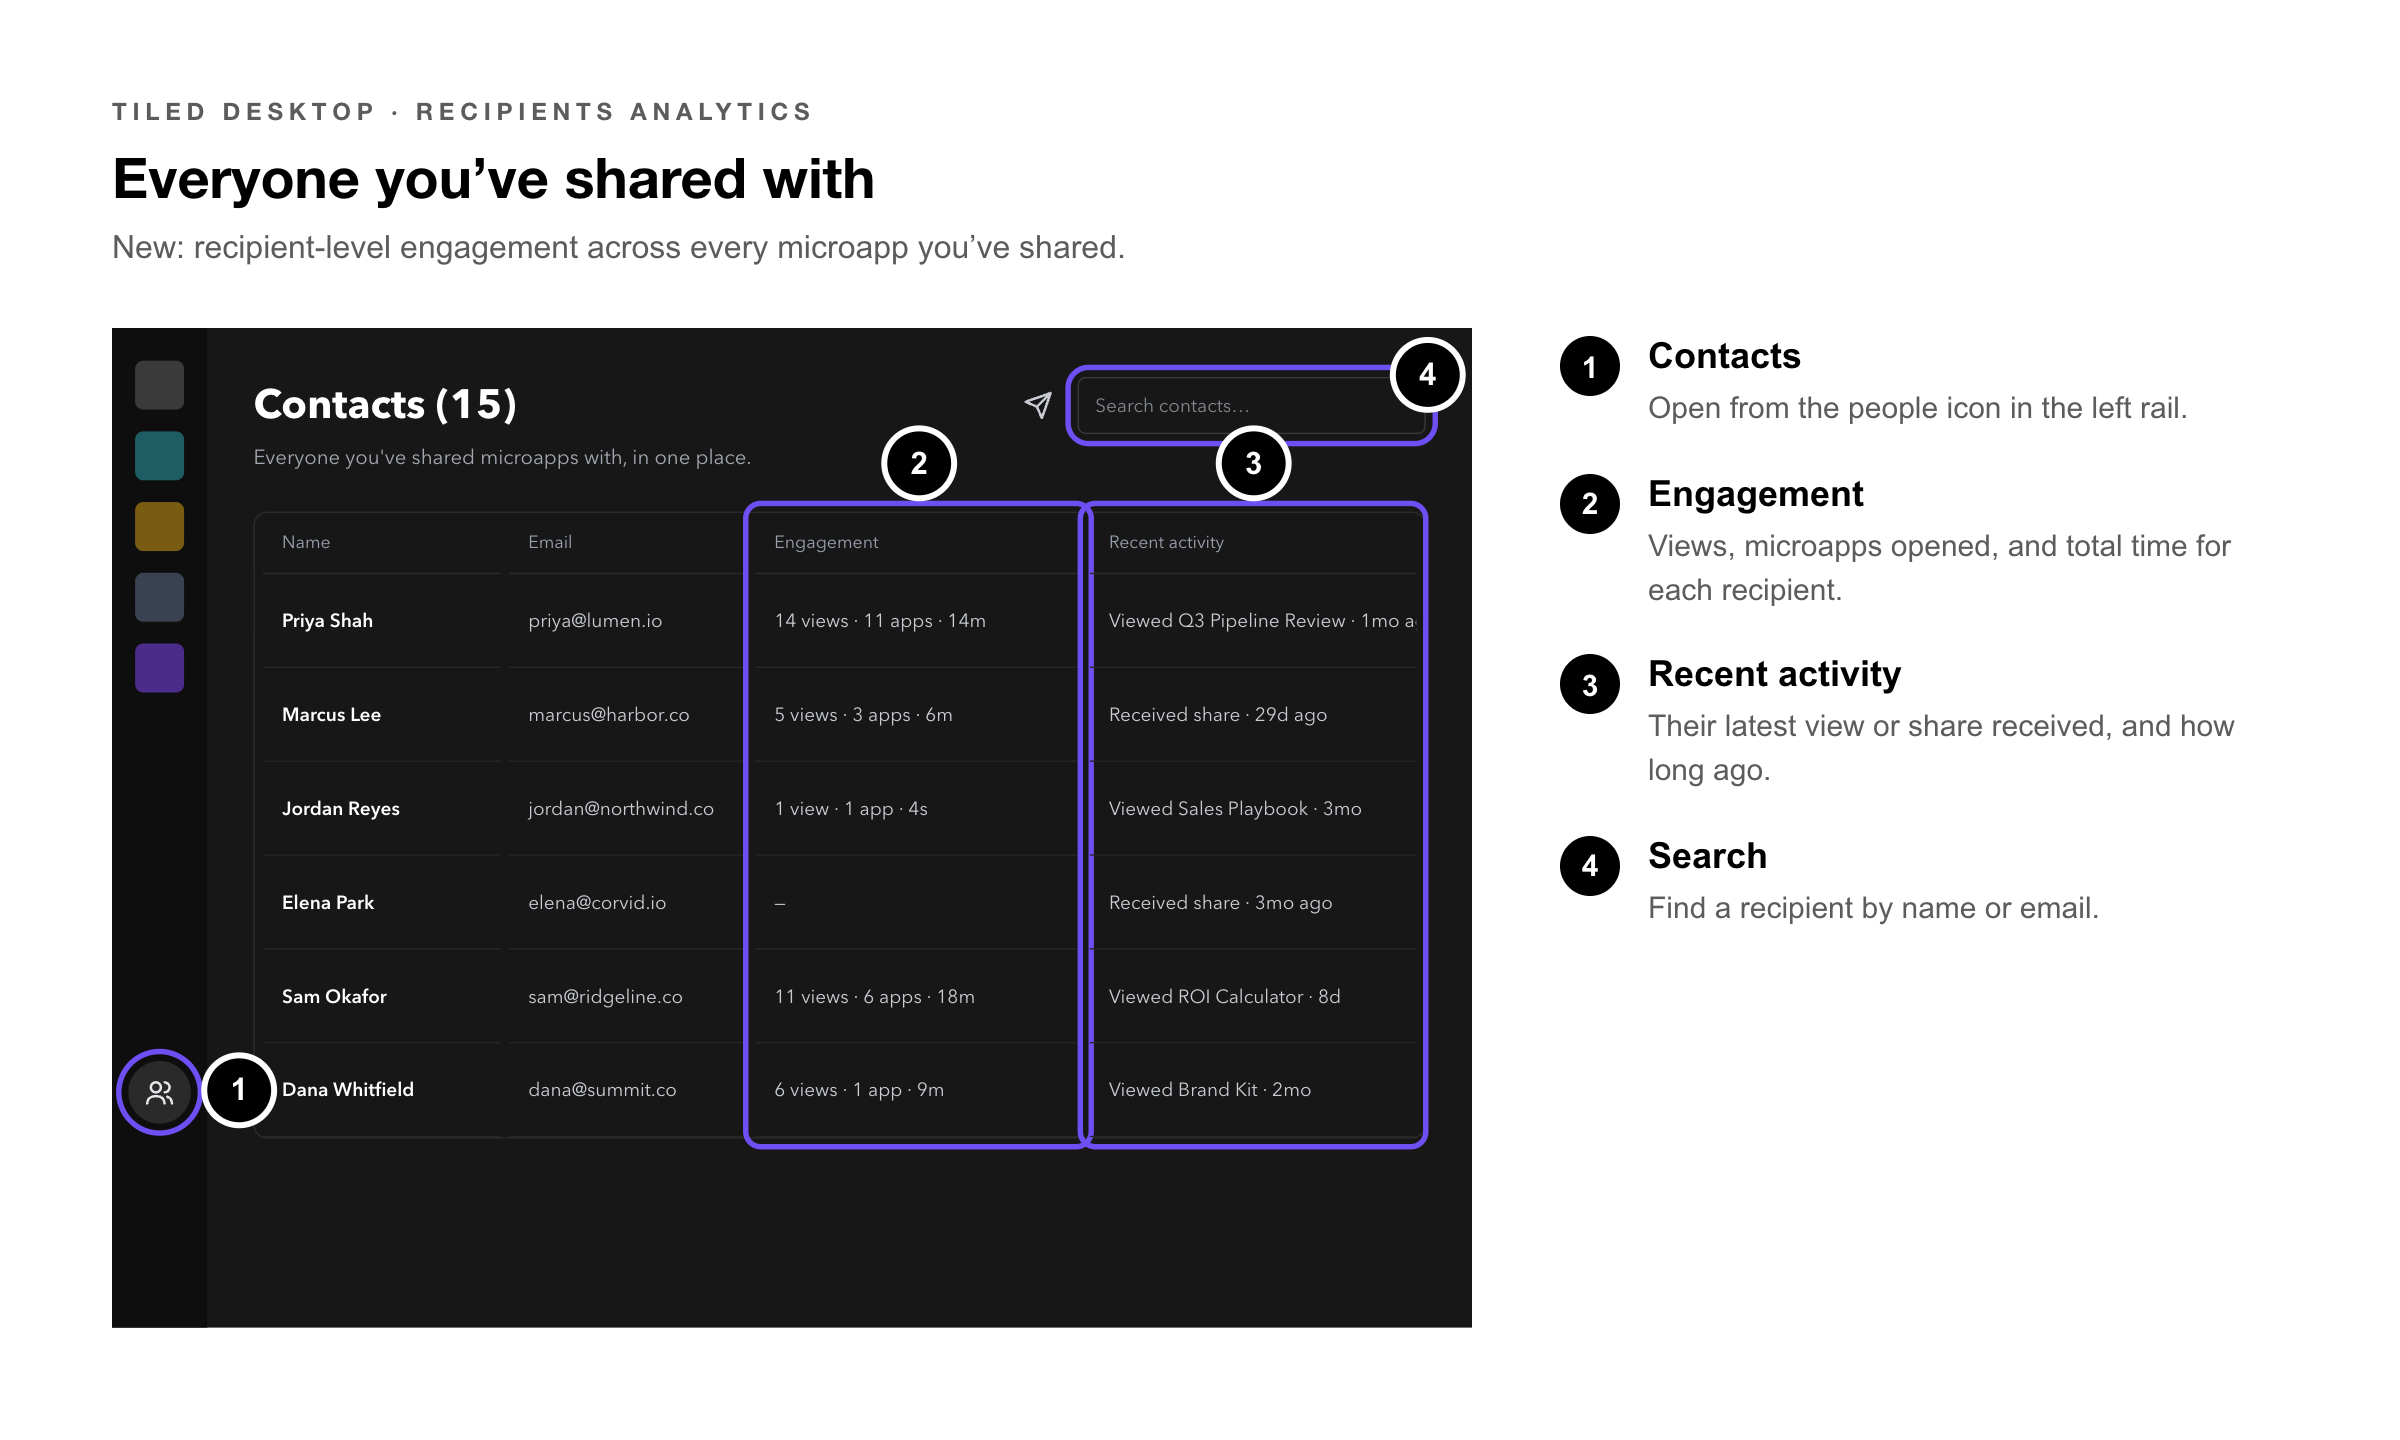
Recipients Analytics (New)
A new Recipients Analytics tool has been introduced alongside Pathway Analytics.
Common Questions
|
Question |
Answer |
|
Why can’t I see Pathway Analytics for a teammate’s link? |
Pathway Analytics is only available for Direct Share links you generated yourself. |
|
Does Pathway Analytics work with Public or SubTag links? |
Pathway Analytics covers microapps shared with Direct Share links. |
|
How do I see which screens a recipient never reached? |
In the Screens Summary, select Unviewed. The count next to it shows how many screens they missed. |
|
How much of the microapp did they actually see? |
The Screens Viewed card shows how many screens they reached and what share of the whole microapp that is. |
|
Why is part of the microapp missing from the pathway? |
Interactions inside embedded content and iframes aren’t tracked. The viewer may also have left before reaching those screens — check Unviewed in the Screens Summary. |
Related Articles
• Direct Share Links — Sending a microapp to a known recipient so their journey can be tracked.
• My Shares — Your share links, and one of the ways into Pathway Analytics.
• Completion Events — Defining the events that Completions measures.
• How to Use Contacts in Tiled — Everyone you’ve shared with, and their engagement over time.
• Engagement: Microapp Analytics — Page-level engagement across all viewers of one microapp.