![logo-horizontal_w.png]](https://support.tiled.co/hs-fs/hubfs/logo-horizontal_w.png?height=30&name=logo-horizontal_w.png)
Overview
The Engagement dashboard gives you a dedicated analytics view for each level of your Tiled content — from individual microapps up to your entire library. Each view shows engagement metrics scoped to that entity, so you can understand how your content is performing at the level of detail you need.
Engagement Views
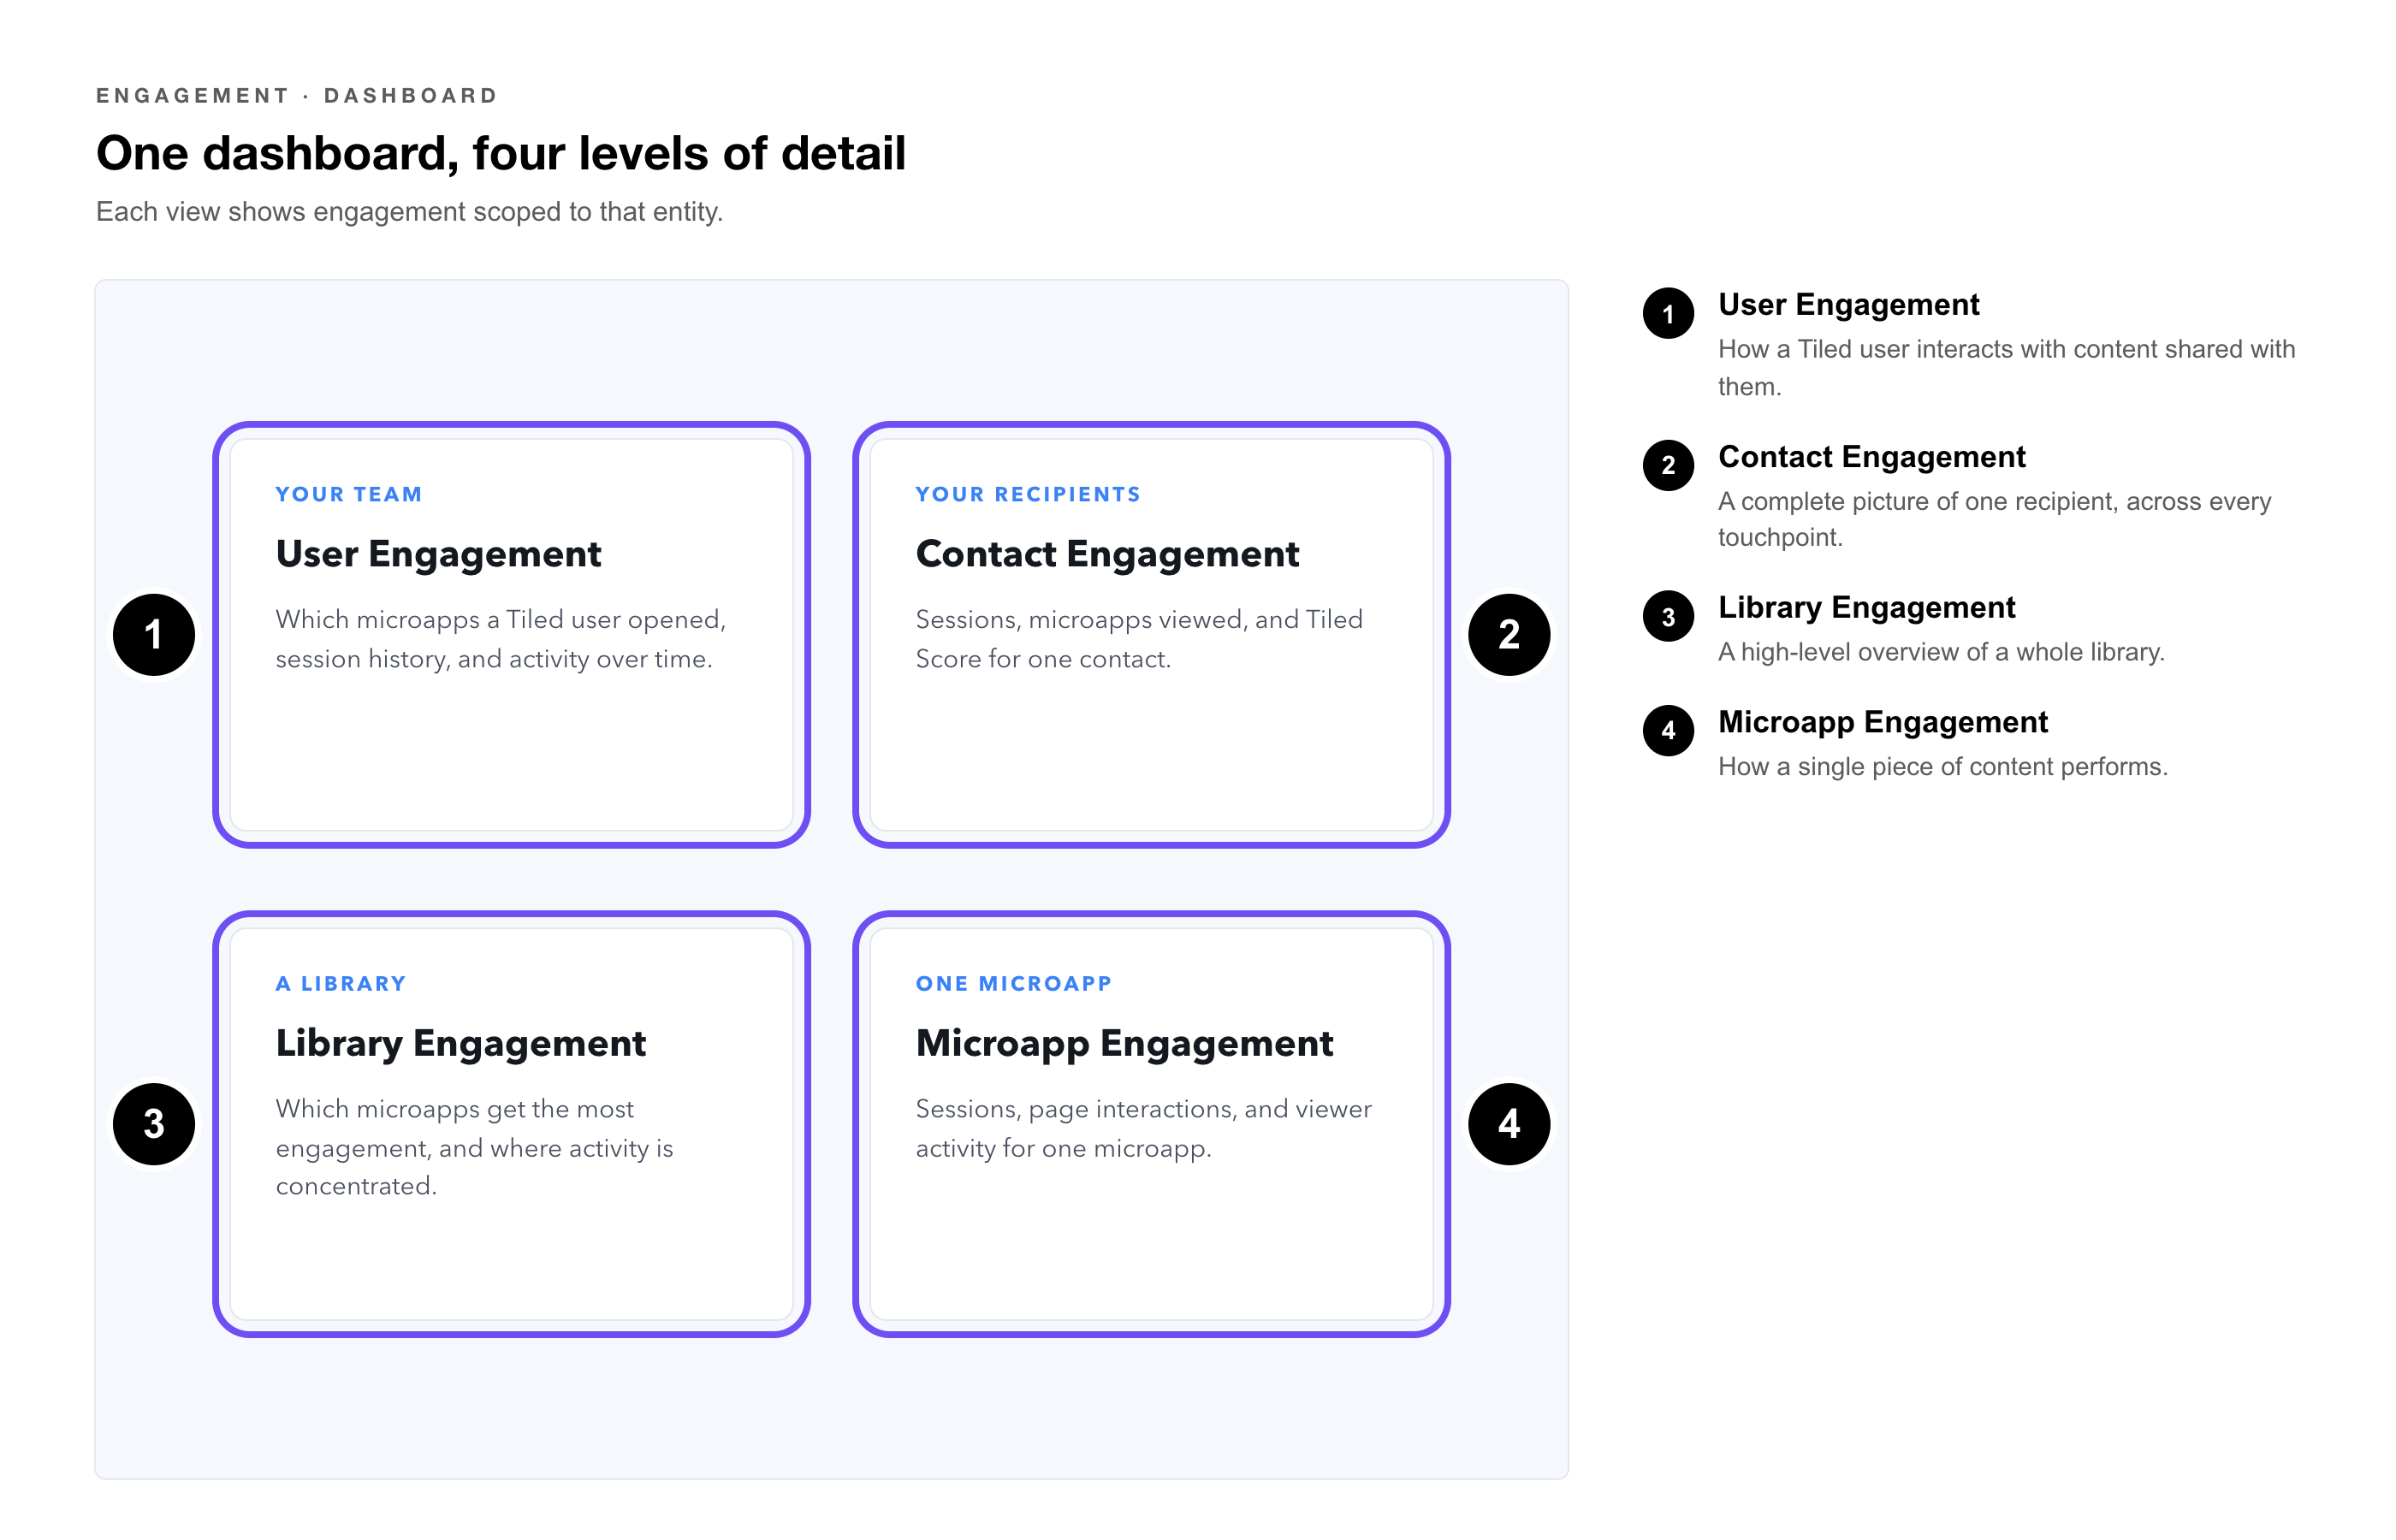
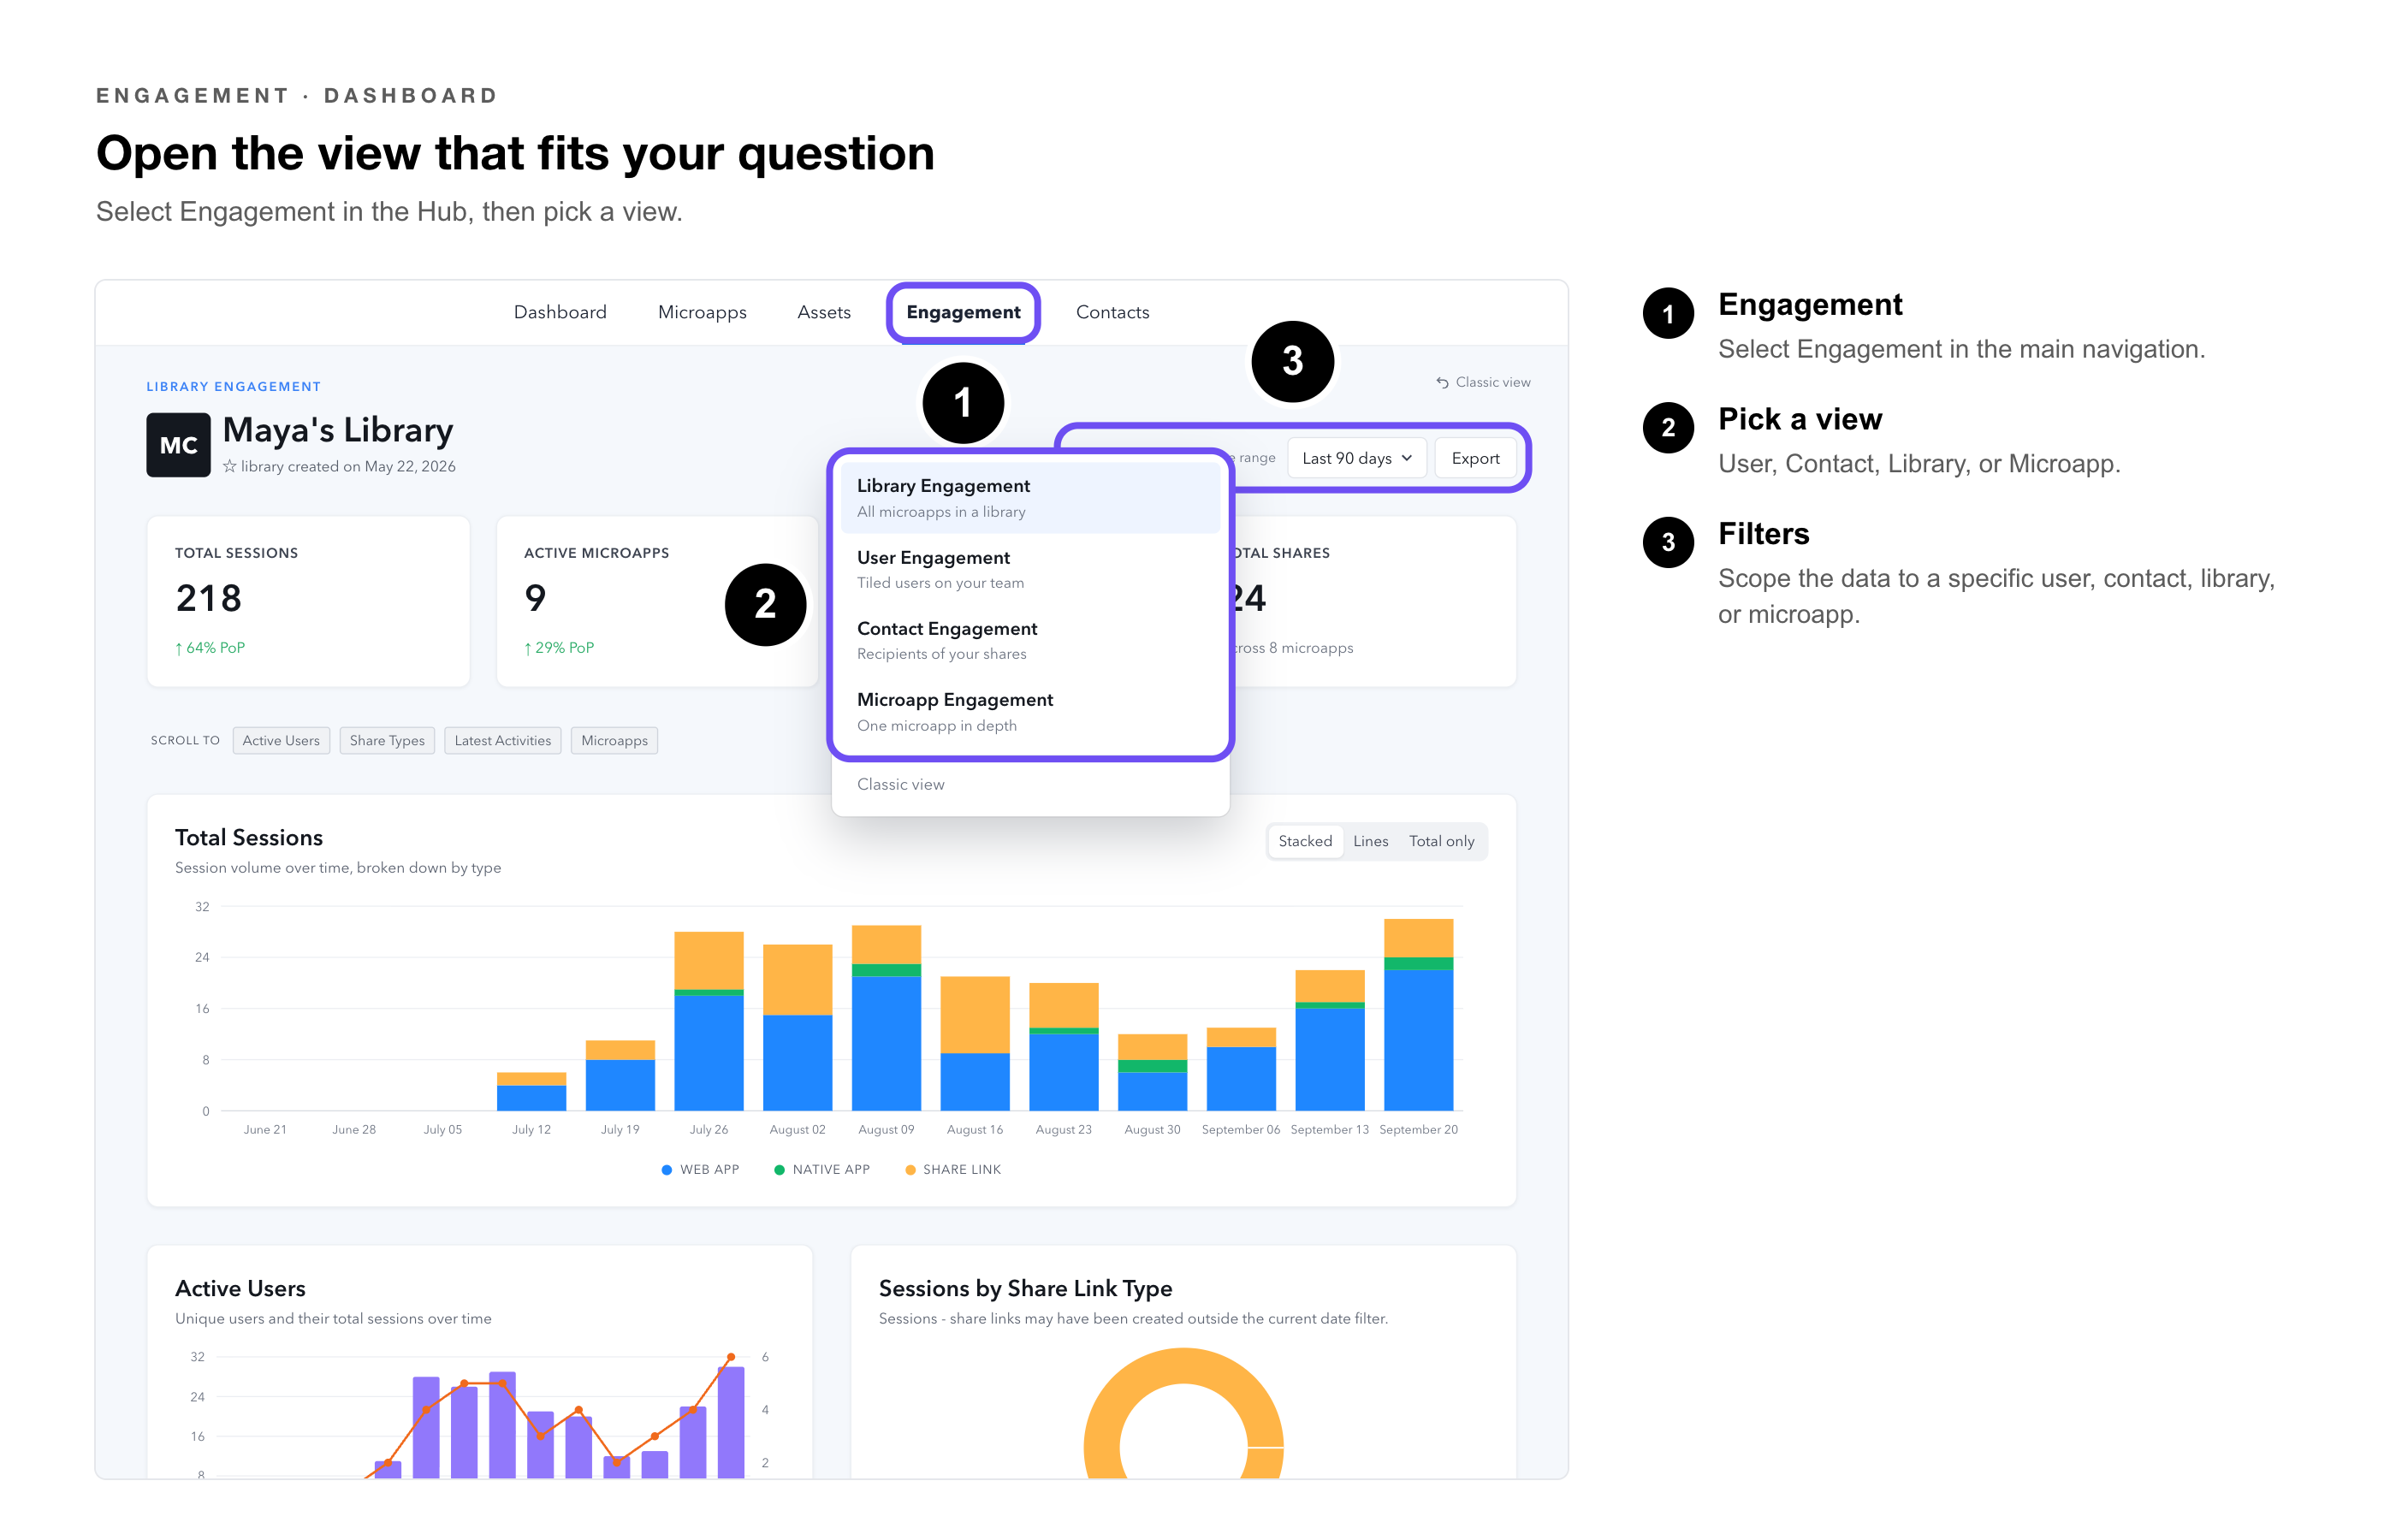
The dashboard includes four dedicated views, each accessible from the main Engagement navigation:
User Engagement
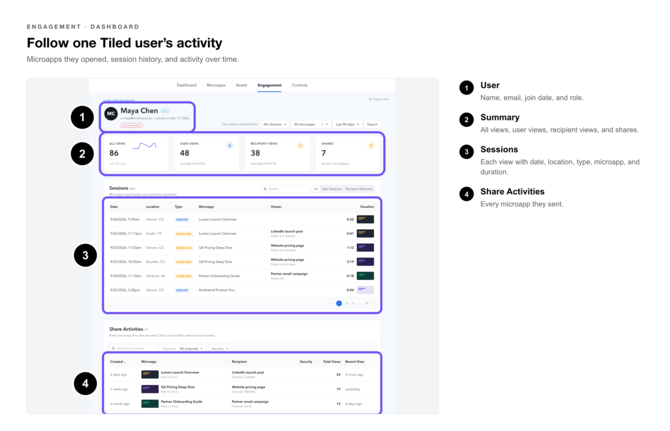
See engagement activity scoped to individual users — which microapps they've opened, session history, and activity over time. Use this view to understand how specific users are interacting with content you've shared with them.
Contact Engagement
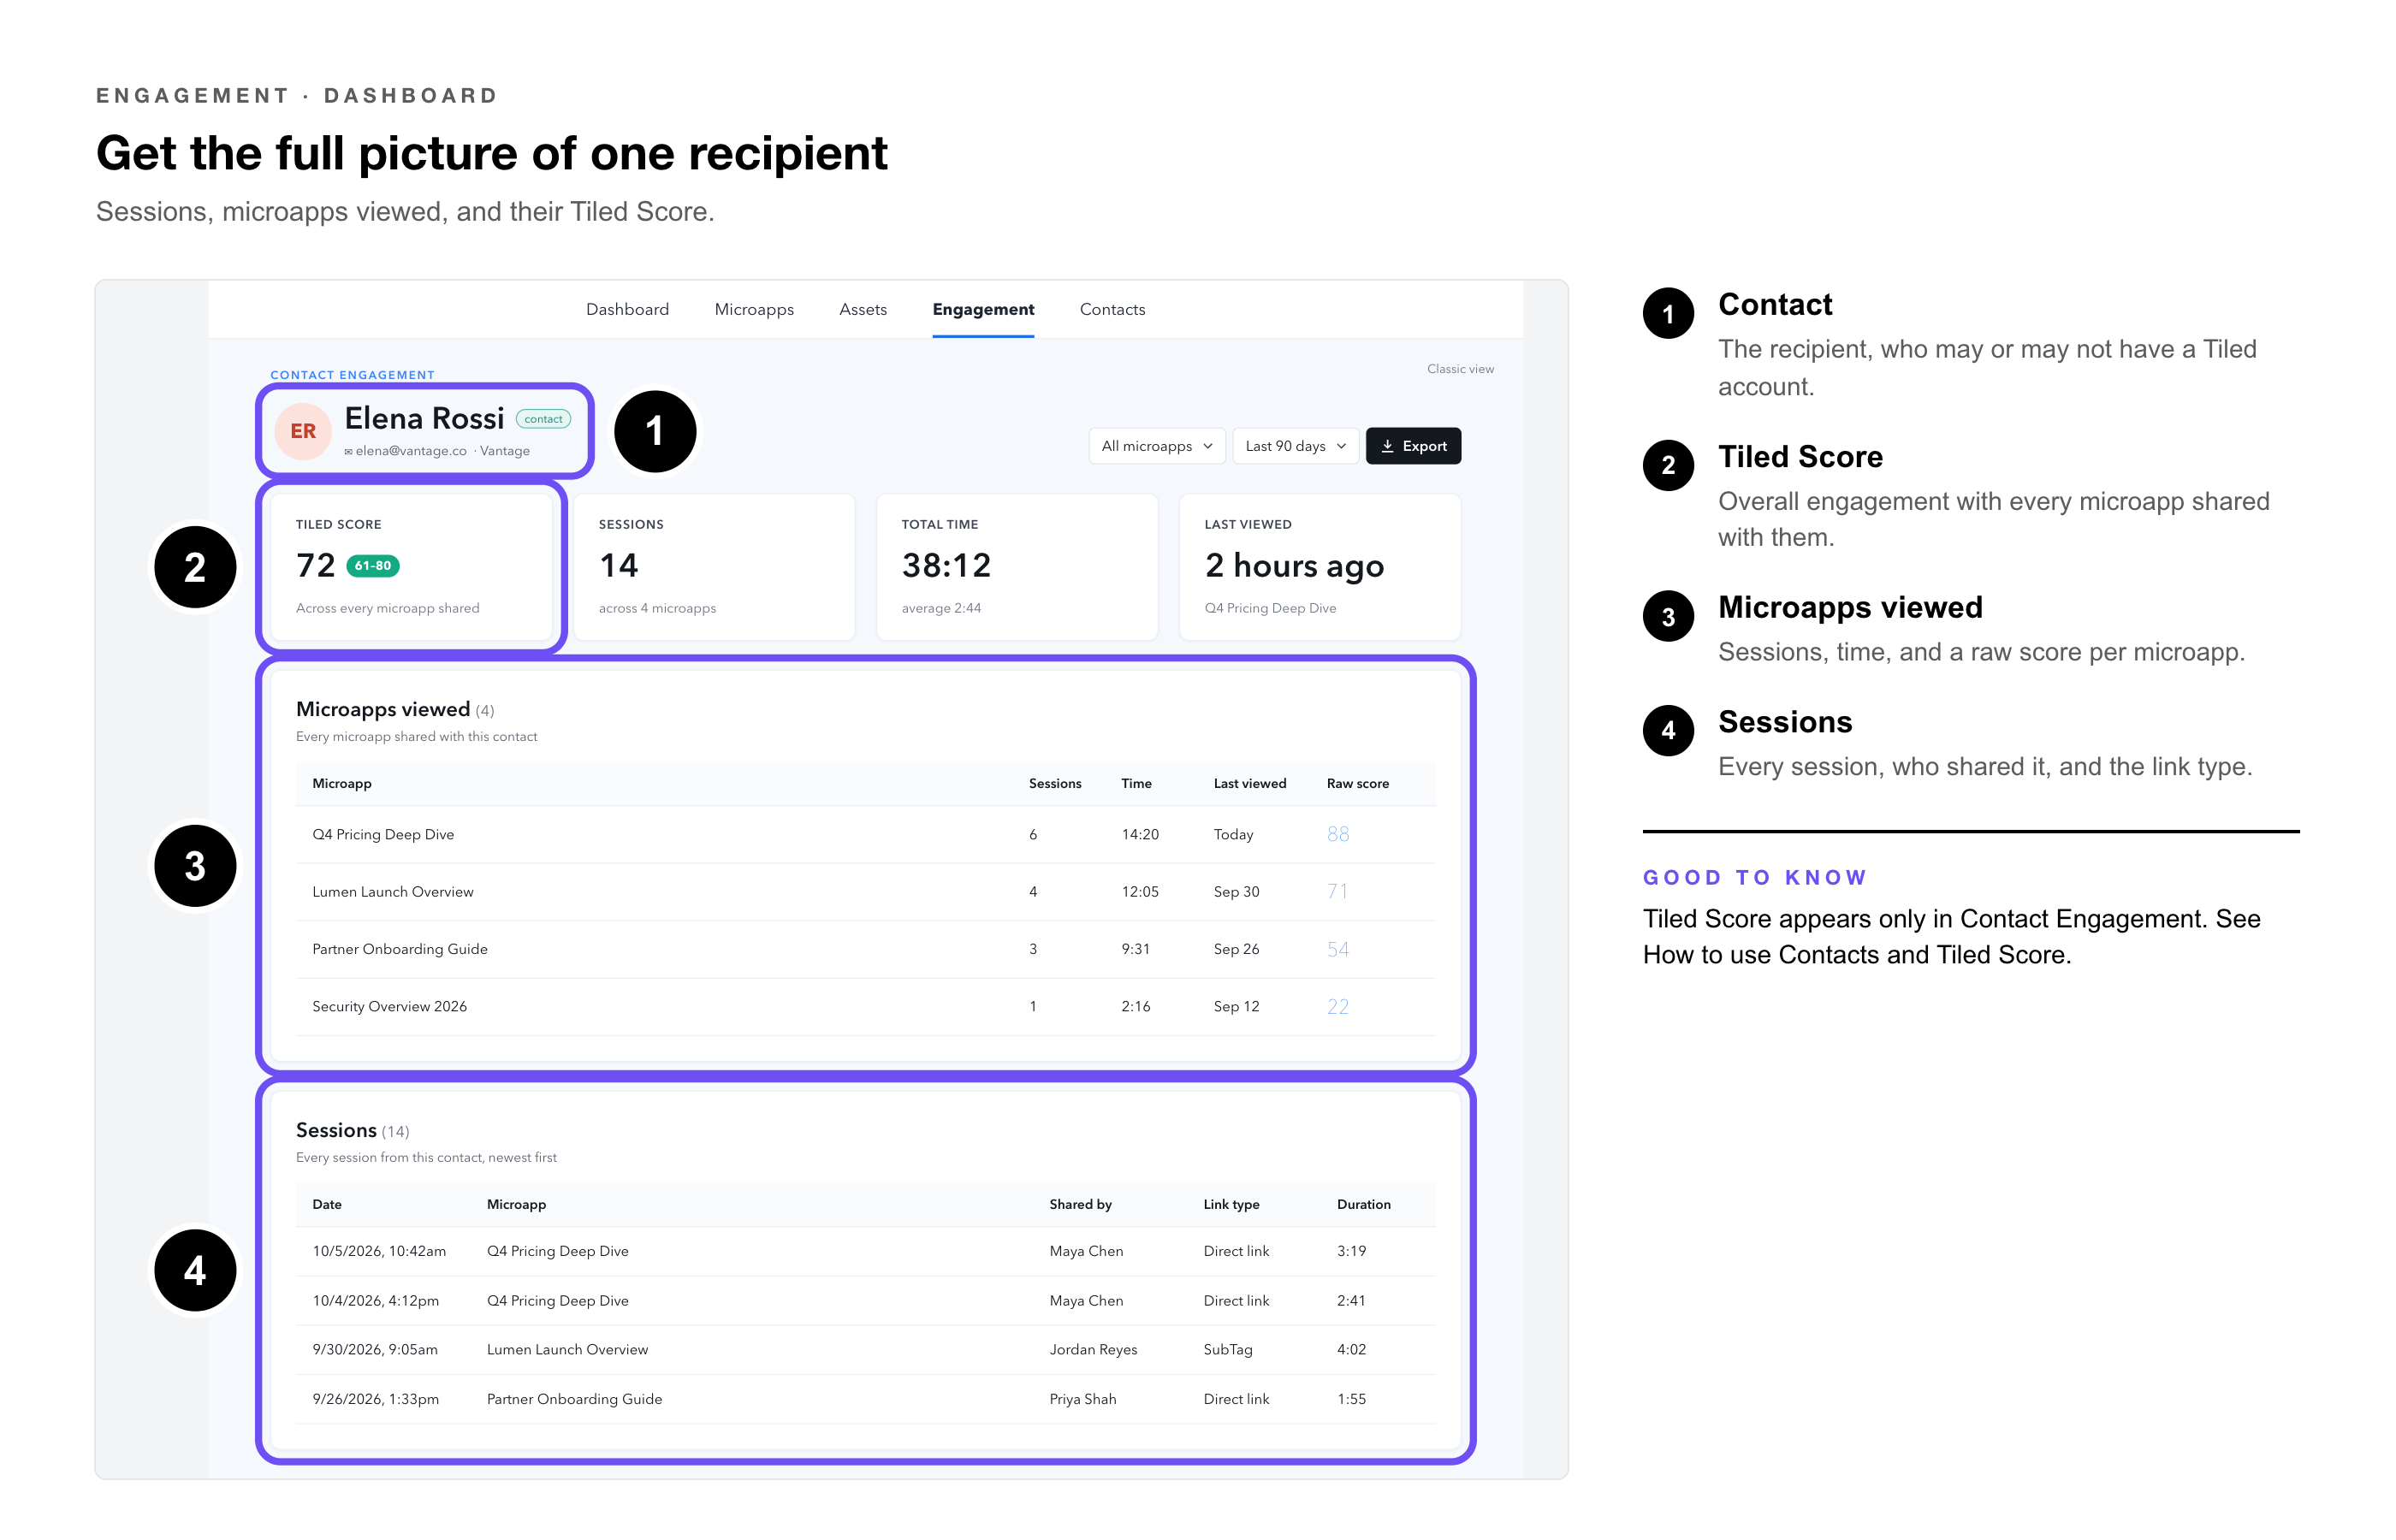
View engagement history for a specific contact — sessions, microapps viewed, and their Tiled Score. Use this view when you want a complete picture of how a recipient has engaged with your content across all touchpoints.
Library Engagement
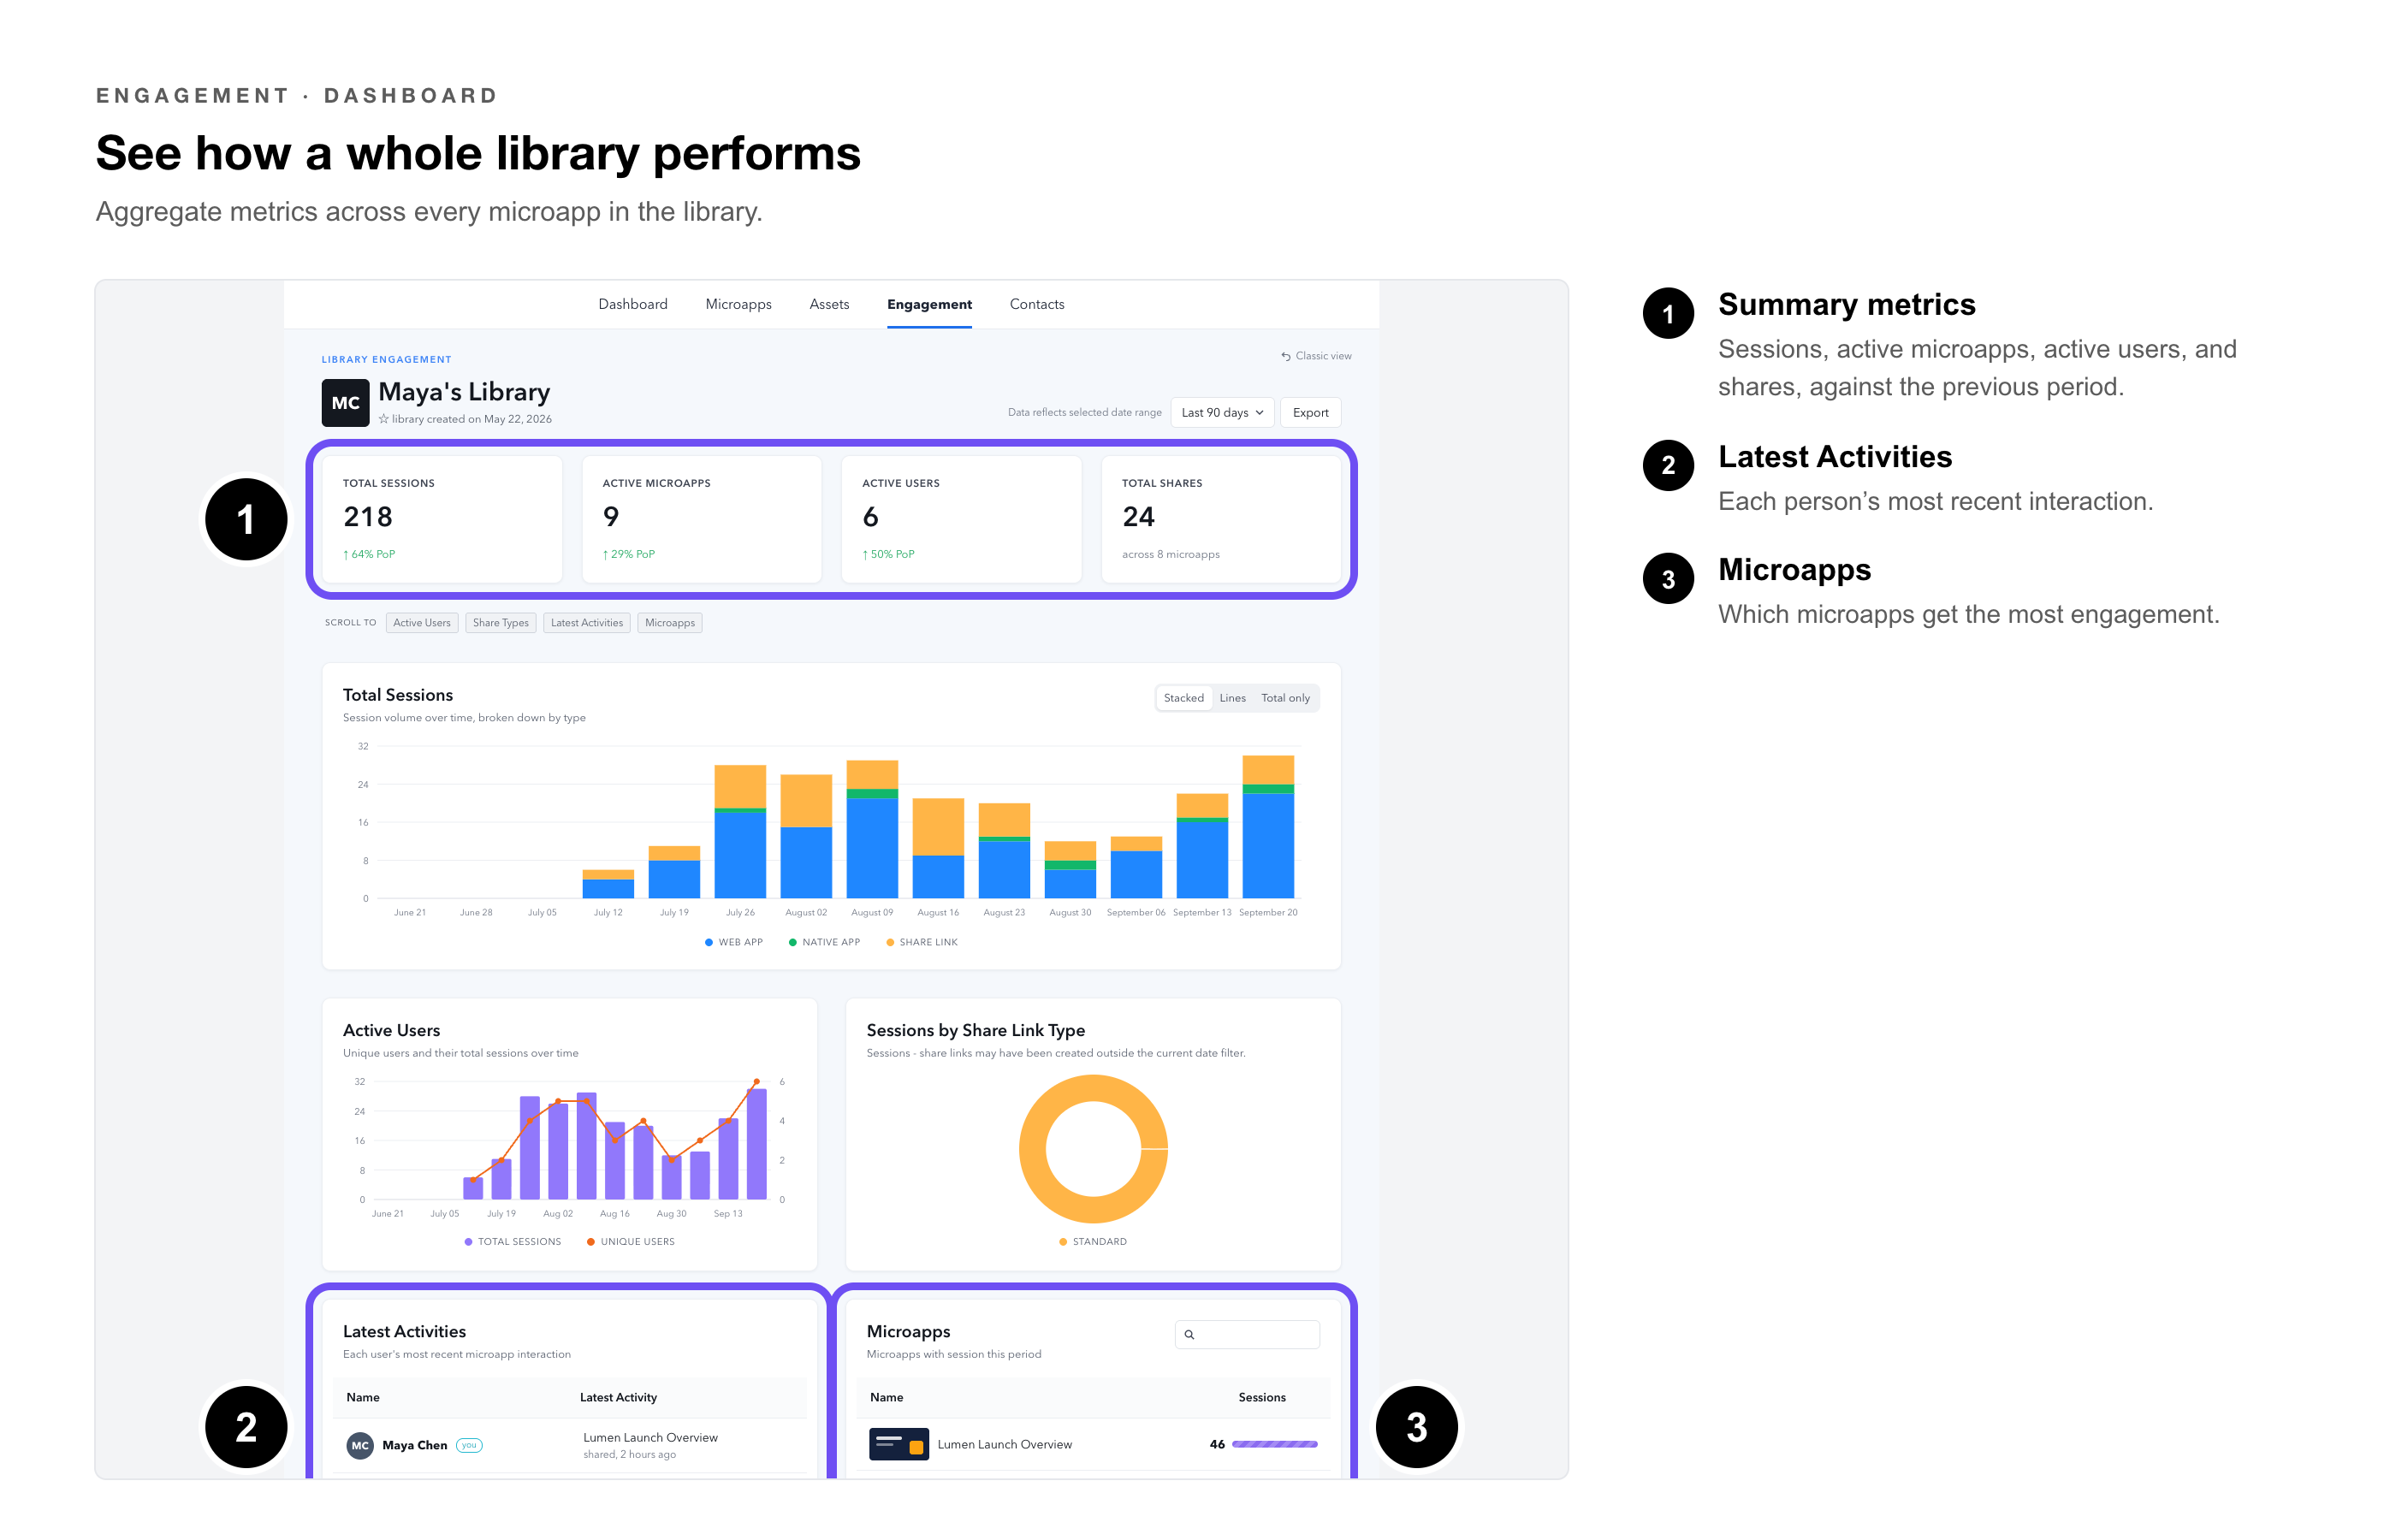
See aggregate engagement metrics across all microapps in a library. Use this view for a high-level performance overview of your content library — which microapps are getting the most engagement, and where activity is concentrated.
Microapp Engagement
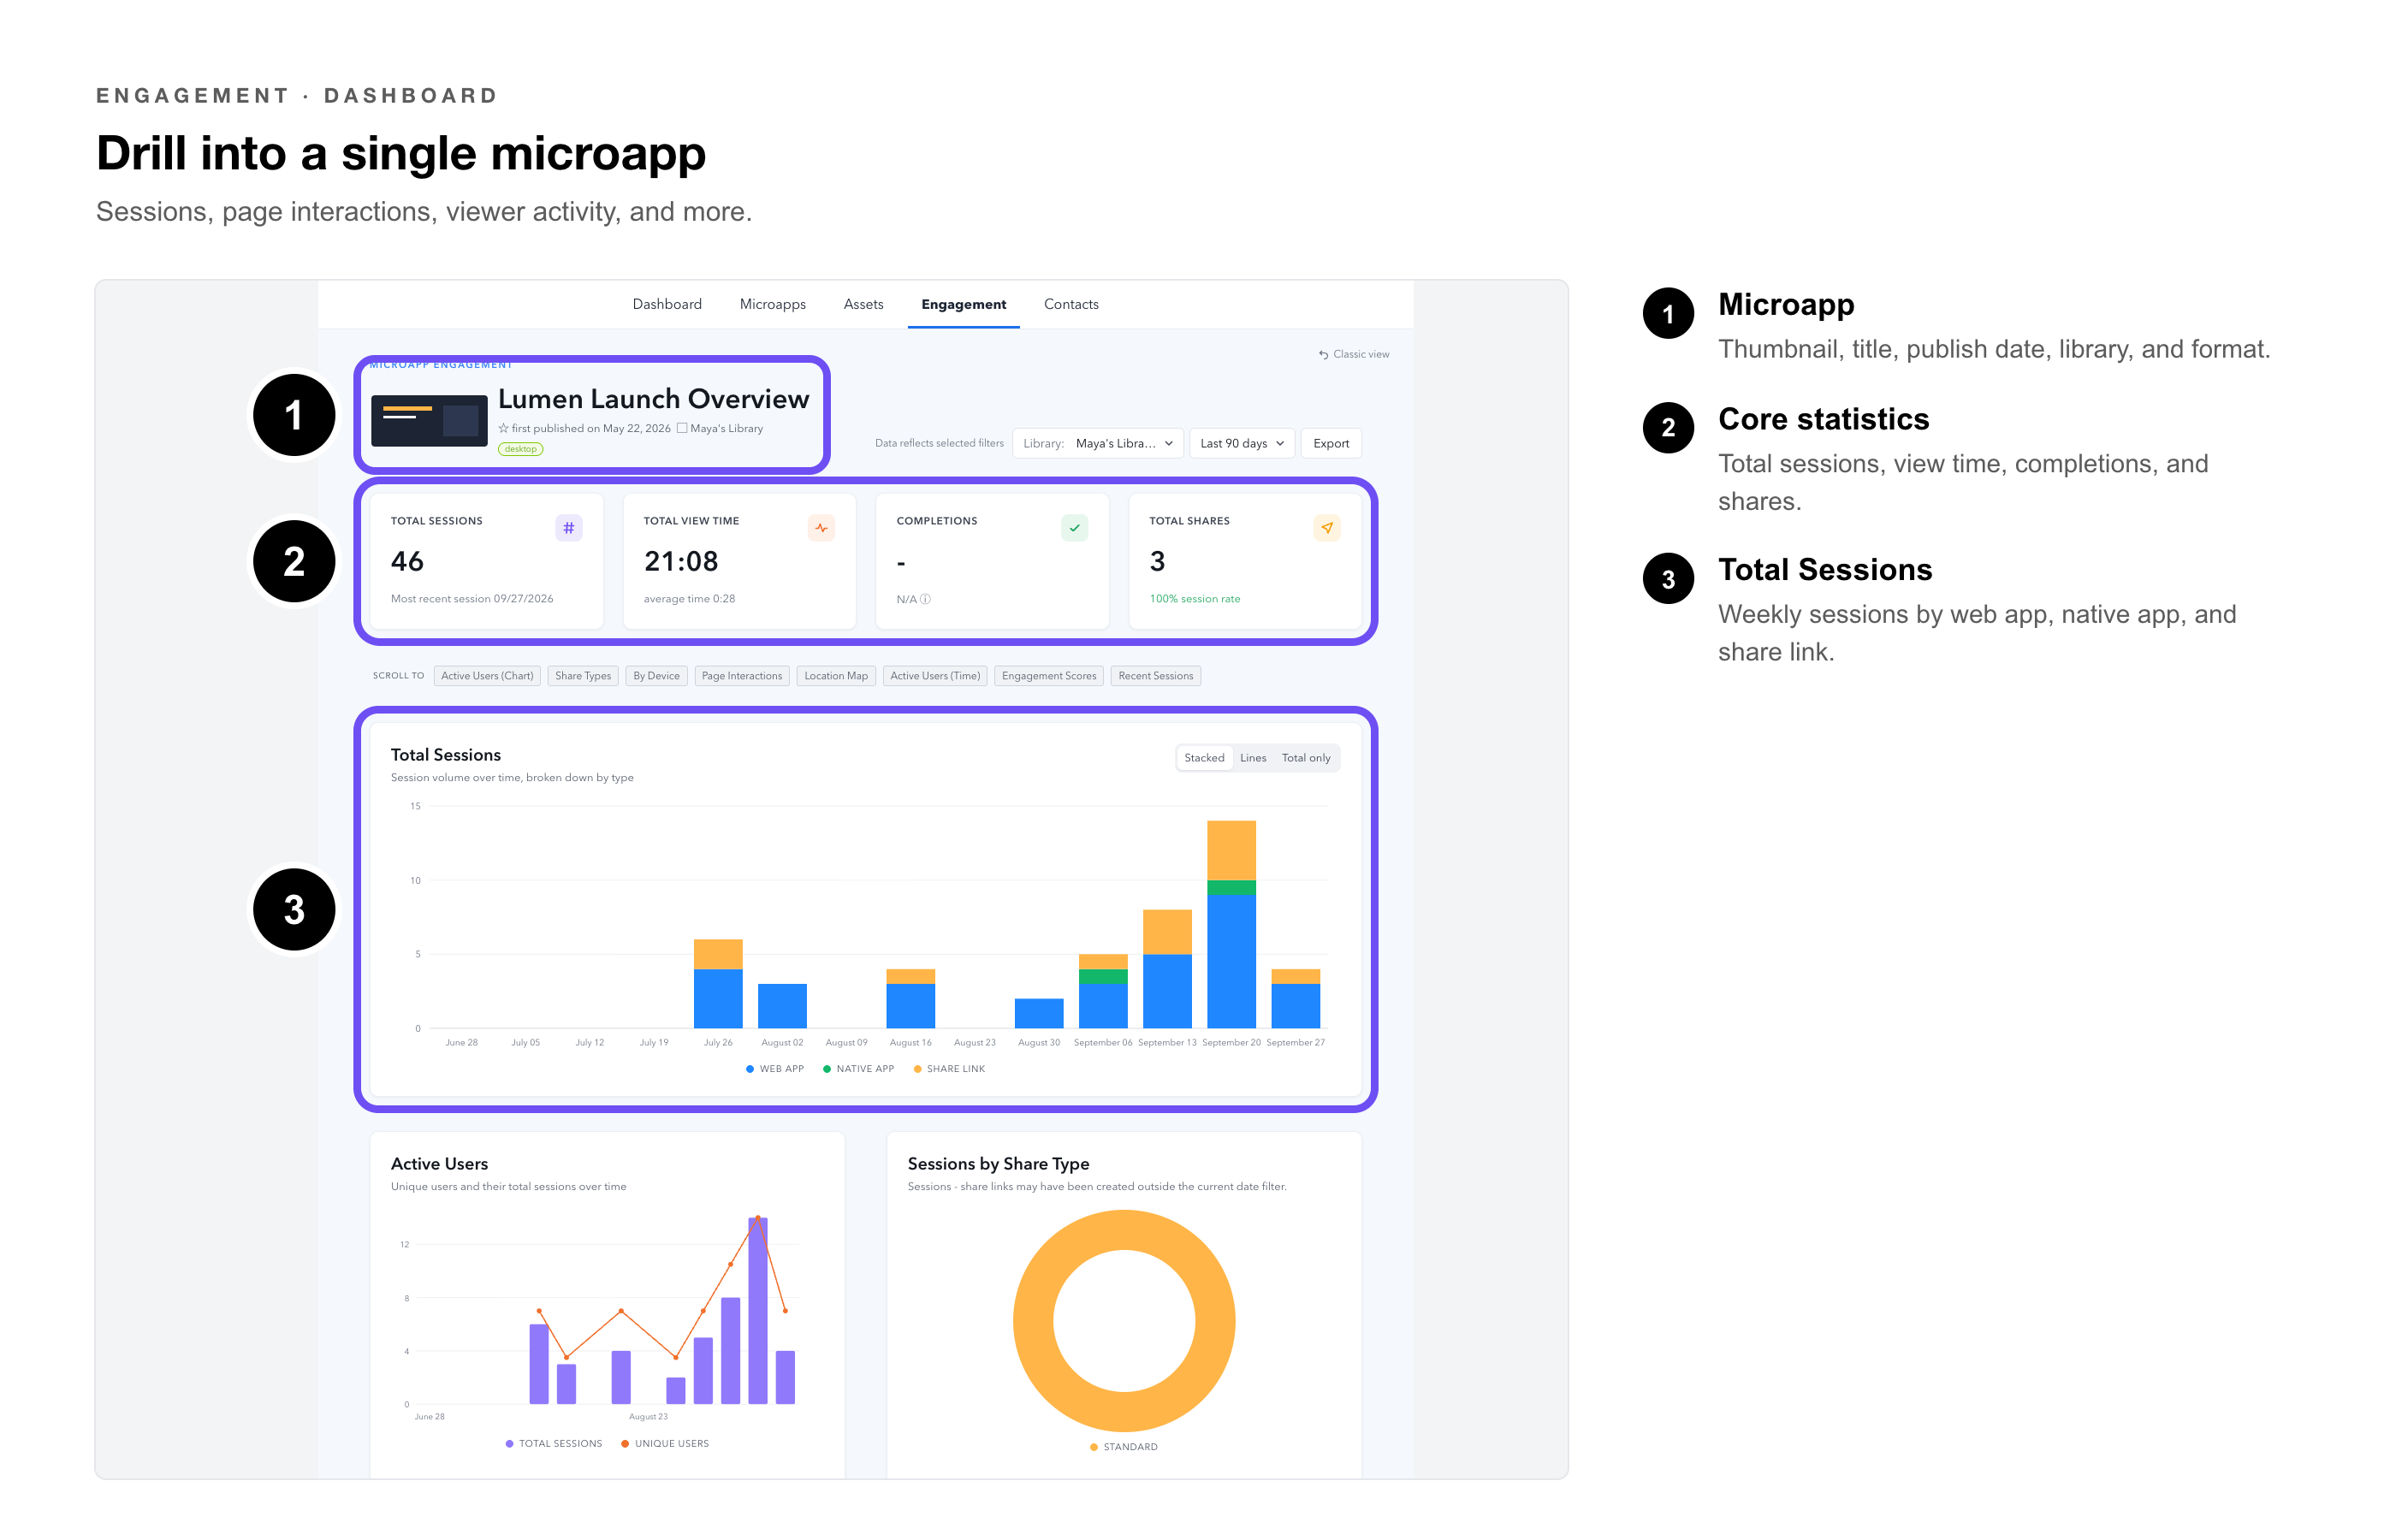
Drill into engagement metrics for a specific microapp — sessions, page interactions, viewer activity, and more. Use this view when you want to understand how a single piece of content is performing.
Navigating to an Engagement View
1. From the Tiled Hub, navigate to Engagement in the main navigation.
2. Select the view that matches what you want to analyze — User, Contact, Library, or Microapp.
3. Use the filters and selectors within each view to scope the data to a specific user, contact, library, or microapp.
Exporting Engagement Data
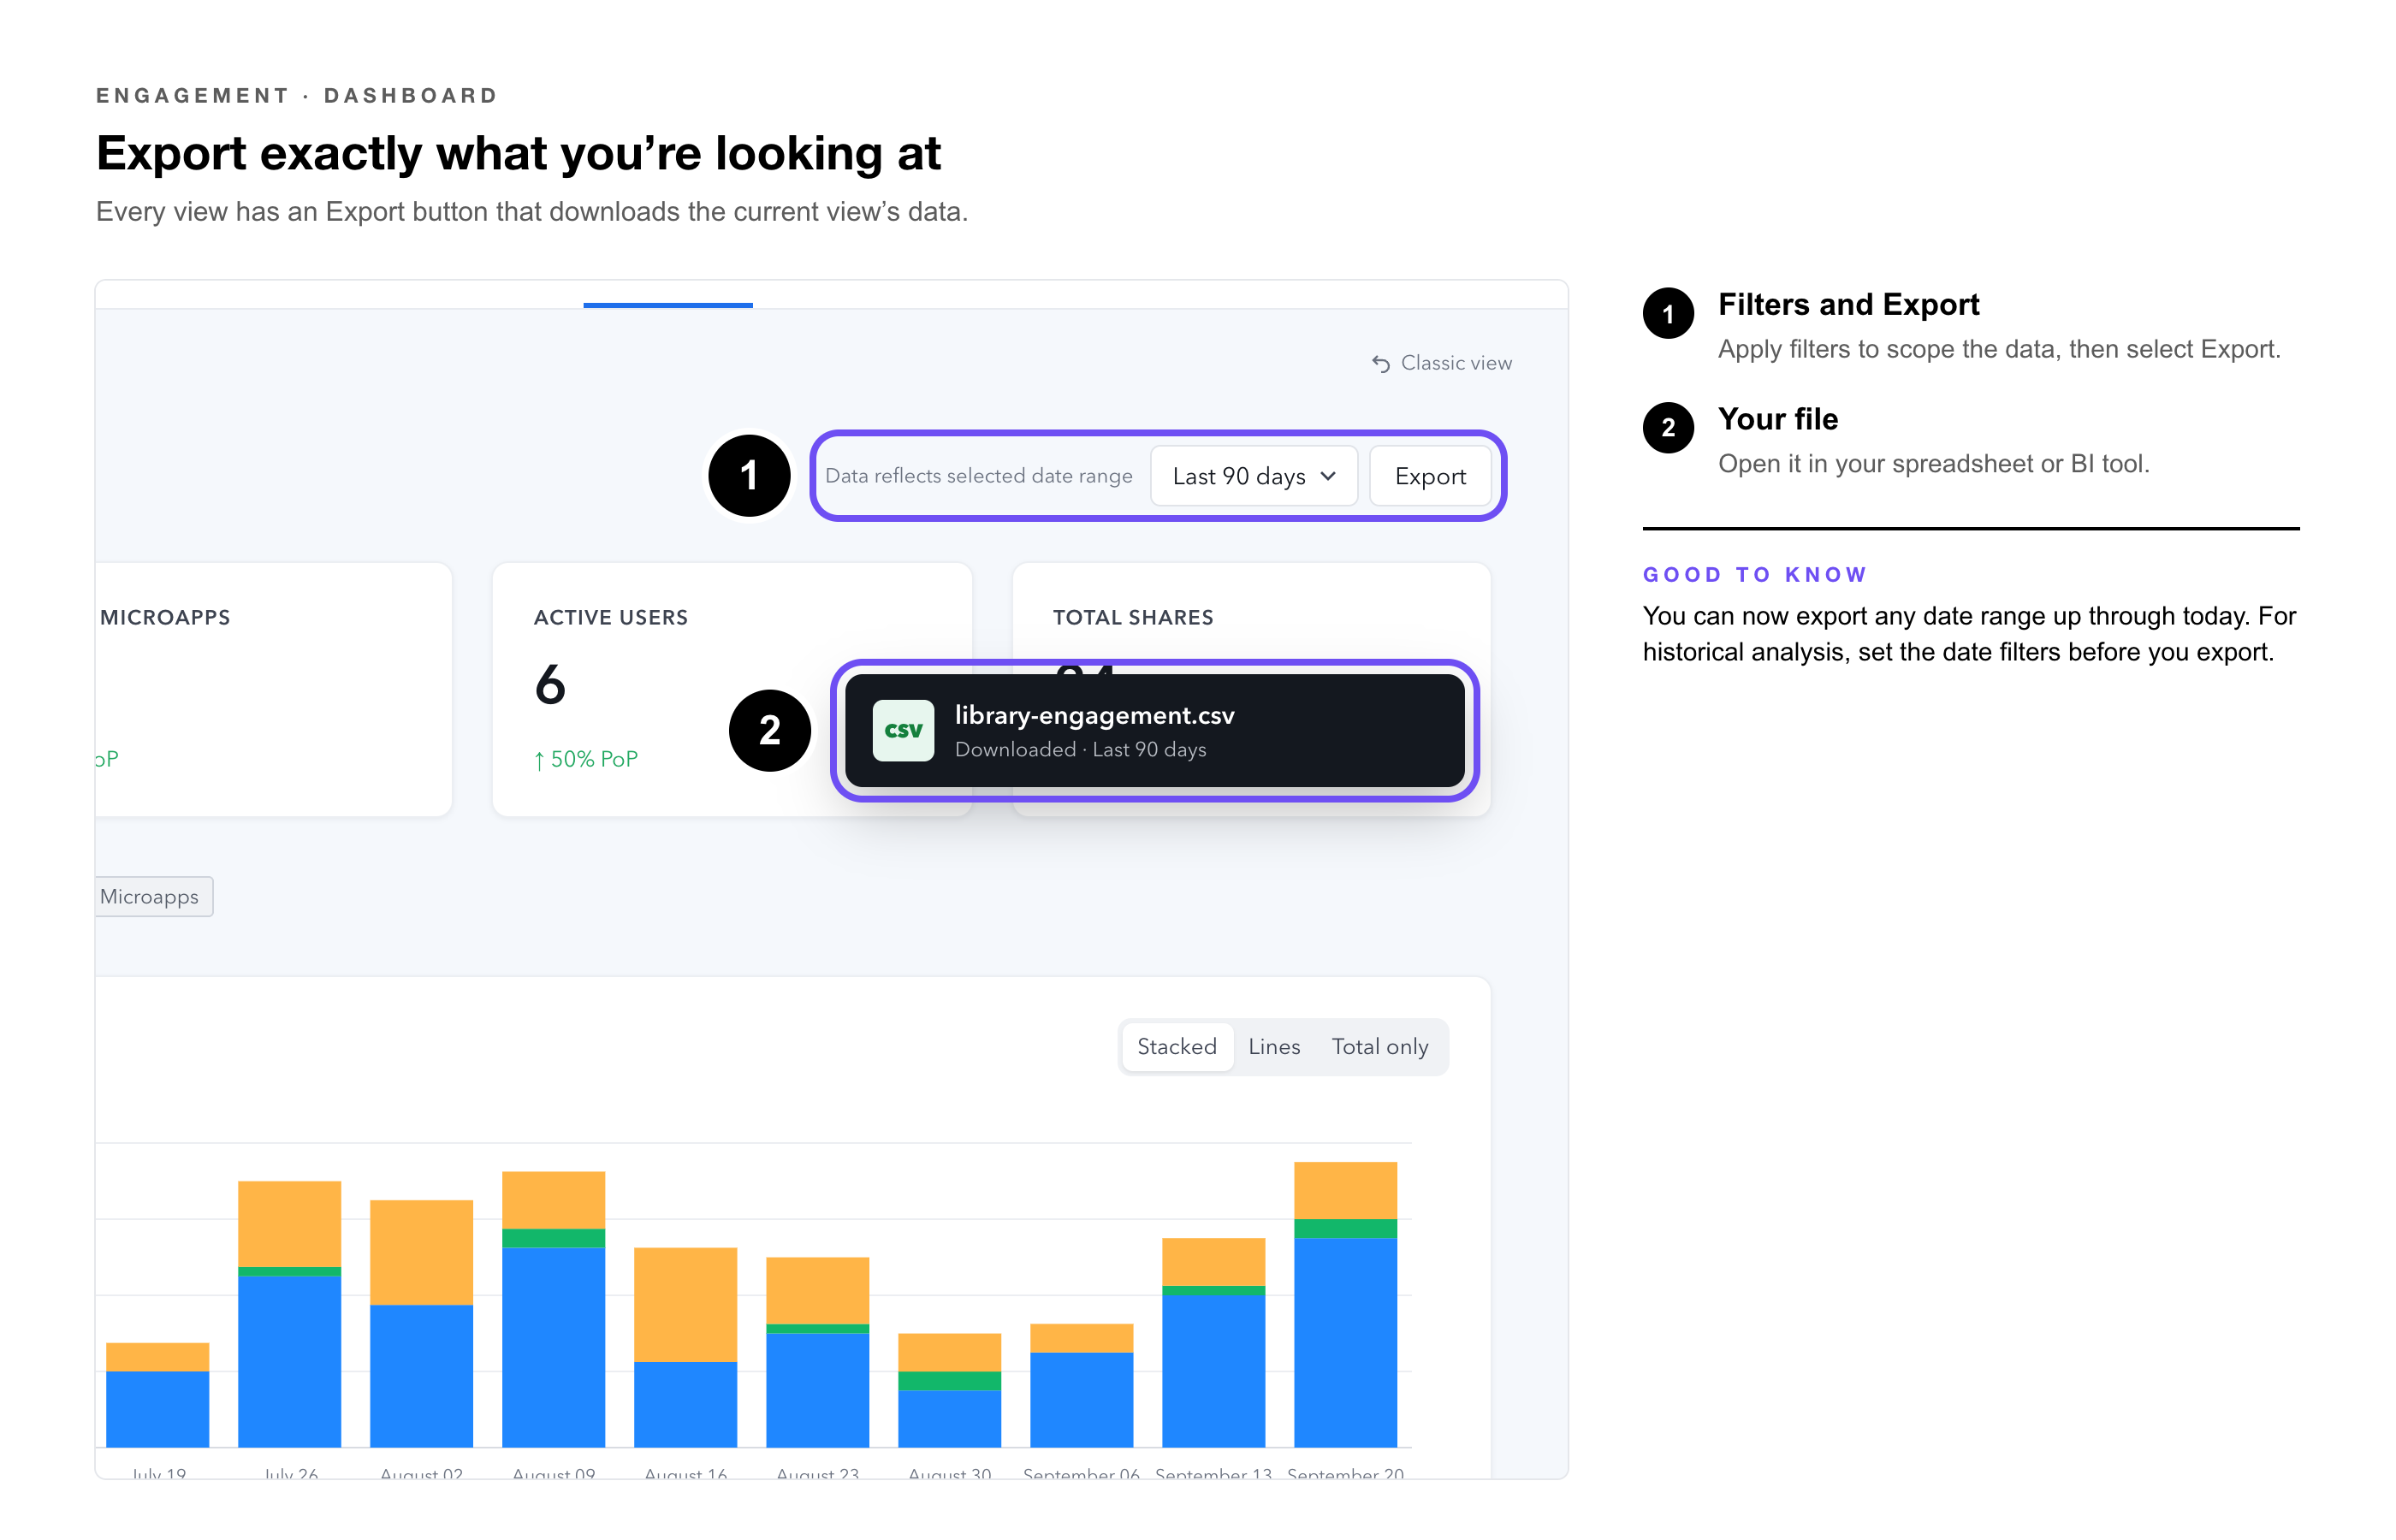
Each engagement view includes an Export button that downloads the current view's data.
1. Navigate to the engagement view you want to export.
2. Apply any filters to scope the data as needed.
3. Click Export.
4. The export downloads as a file you can open in your preferred spreadsheet or BI tool.
Switching to Classic Engagement View
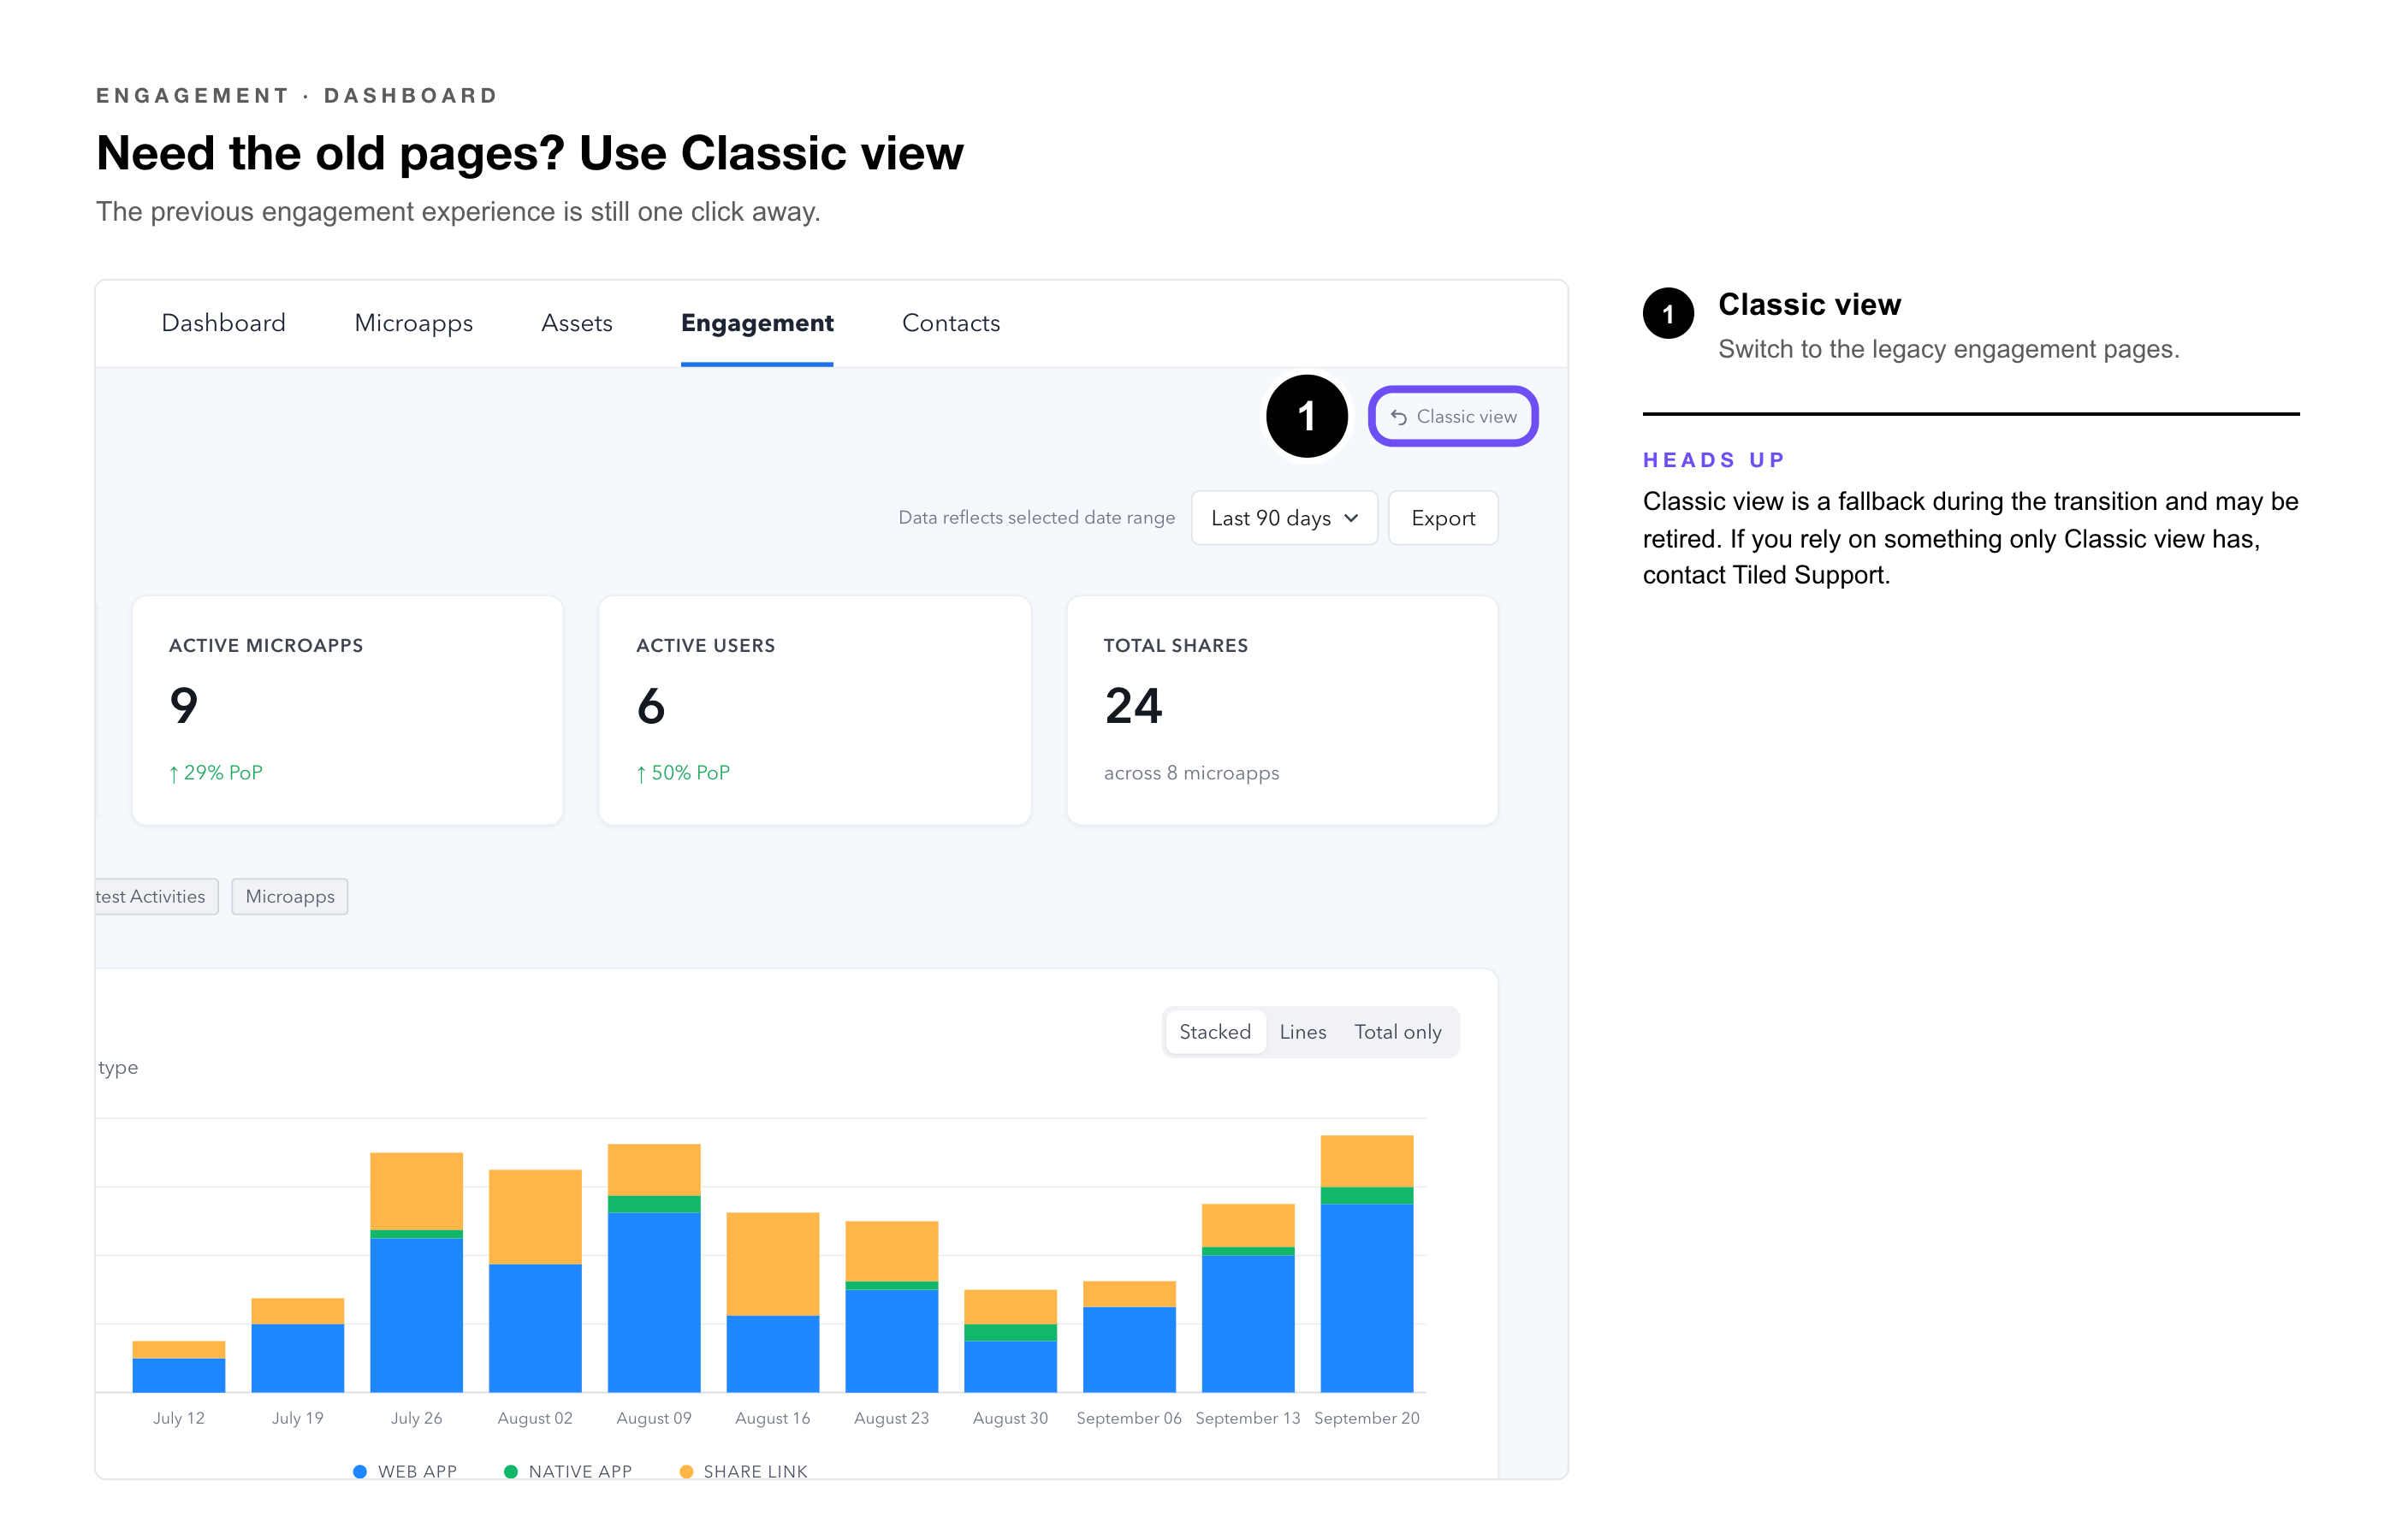
If you need to access the previous engagement experience, a Classic View fallback is available.
1. From the Engagement dashboard, look for the Classic View option in the navigation or view selector.
2. Select it to switch to the legacy engagement pages.
|
Note: Classic View is provided as a fallback during the transition to the new dashboard. It may be retired in a future release — if there are specific capabilities you rely on in Classic View that aren't available in the new dashboard, contact Tiled Support. |
Common Questions
What is Tiled Score?
Tiled Score is a per-contact engagement score visible in the Contact Engagement view. It reflects the overall level of engagement a contact has had with microapps shared with them. See How to use Contacts and Tiled Score for more details.
What's the difference between User Engagement and Contact Engagement?
User Engagement is scoped to authenticated Tiled users — people who have a Tiled account. Contact Engagement is scoped to viewer contacts — recipients of shared microapps, who may or may not have a Tiled account. Use Contact Engagement to track external recipients; use User Engagement to track internal team activity.
How far back does engagement data go?
The maximum date range for engagement data exports has been extended — you can now select any date range up through today when exporting. If you need a custom range for historical analysis, use the date filters within the relevant Engagement view before exporting.
I used to use the old engagement pages — where did they go?
The previous engagement experience is still accessible via the Classic View option in the Engagement dashboard. The new dashboard replaces the legacy pages as the primary experience.