![logo-horizontal_w.png]](https://support.tiled.co/hs-fs/hubfs/logo-horizontal_w.png?height=30&name=logo-horizontal_w.png)
For admins and the people who build microapps, the Dashboard is a quick read on the whole account: how much your content is being used, which microapps are working, which libraries and teams are active, and what needs attention. Ask Tiled AI to go deeper on anything you see.
|
Available on Request: The Dashboard is available on request. Email support@tiled.co to turn it on for your account. |
Account Stats
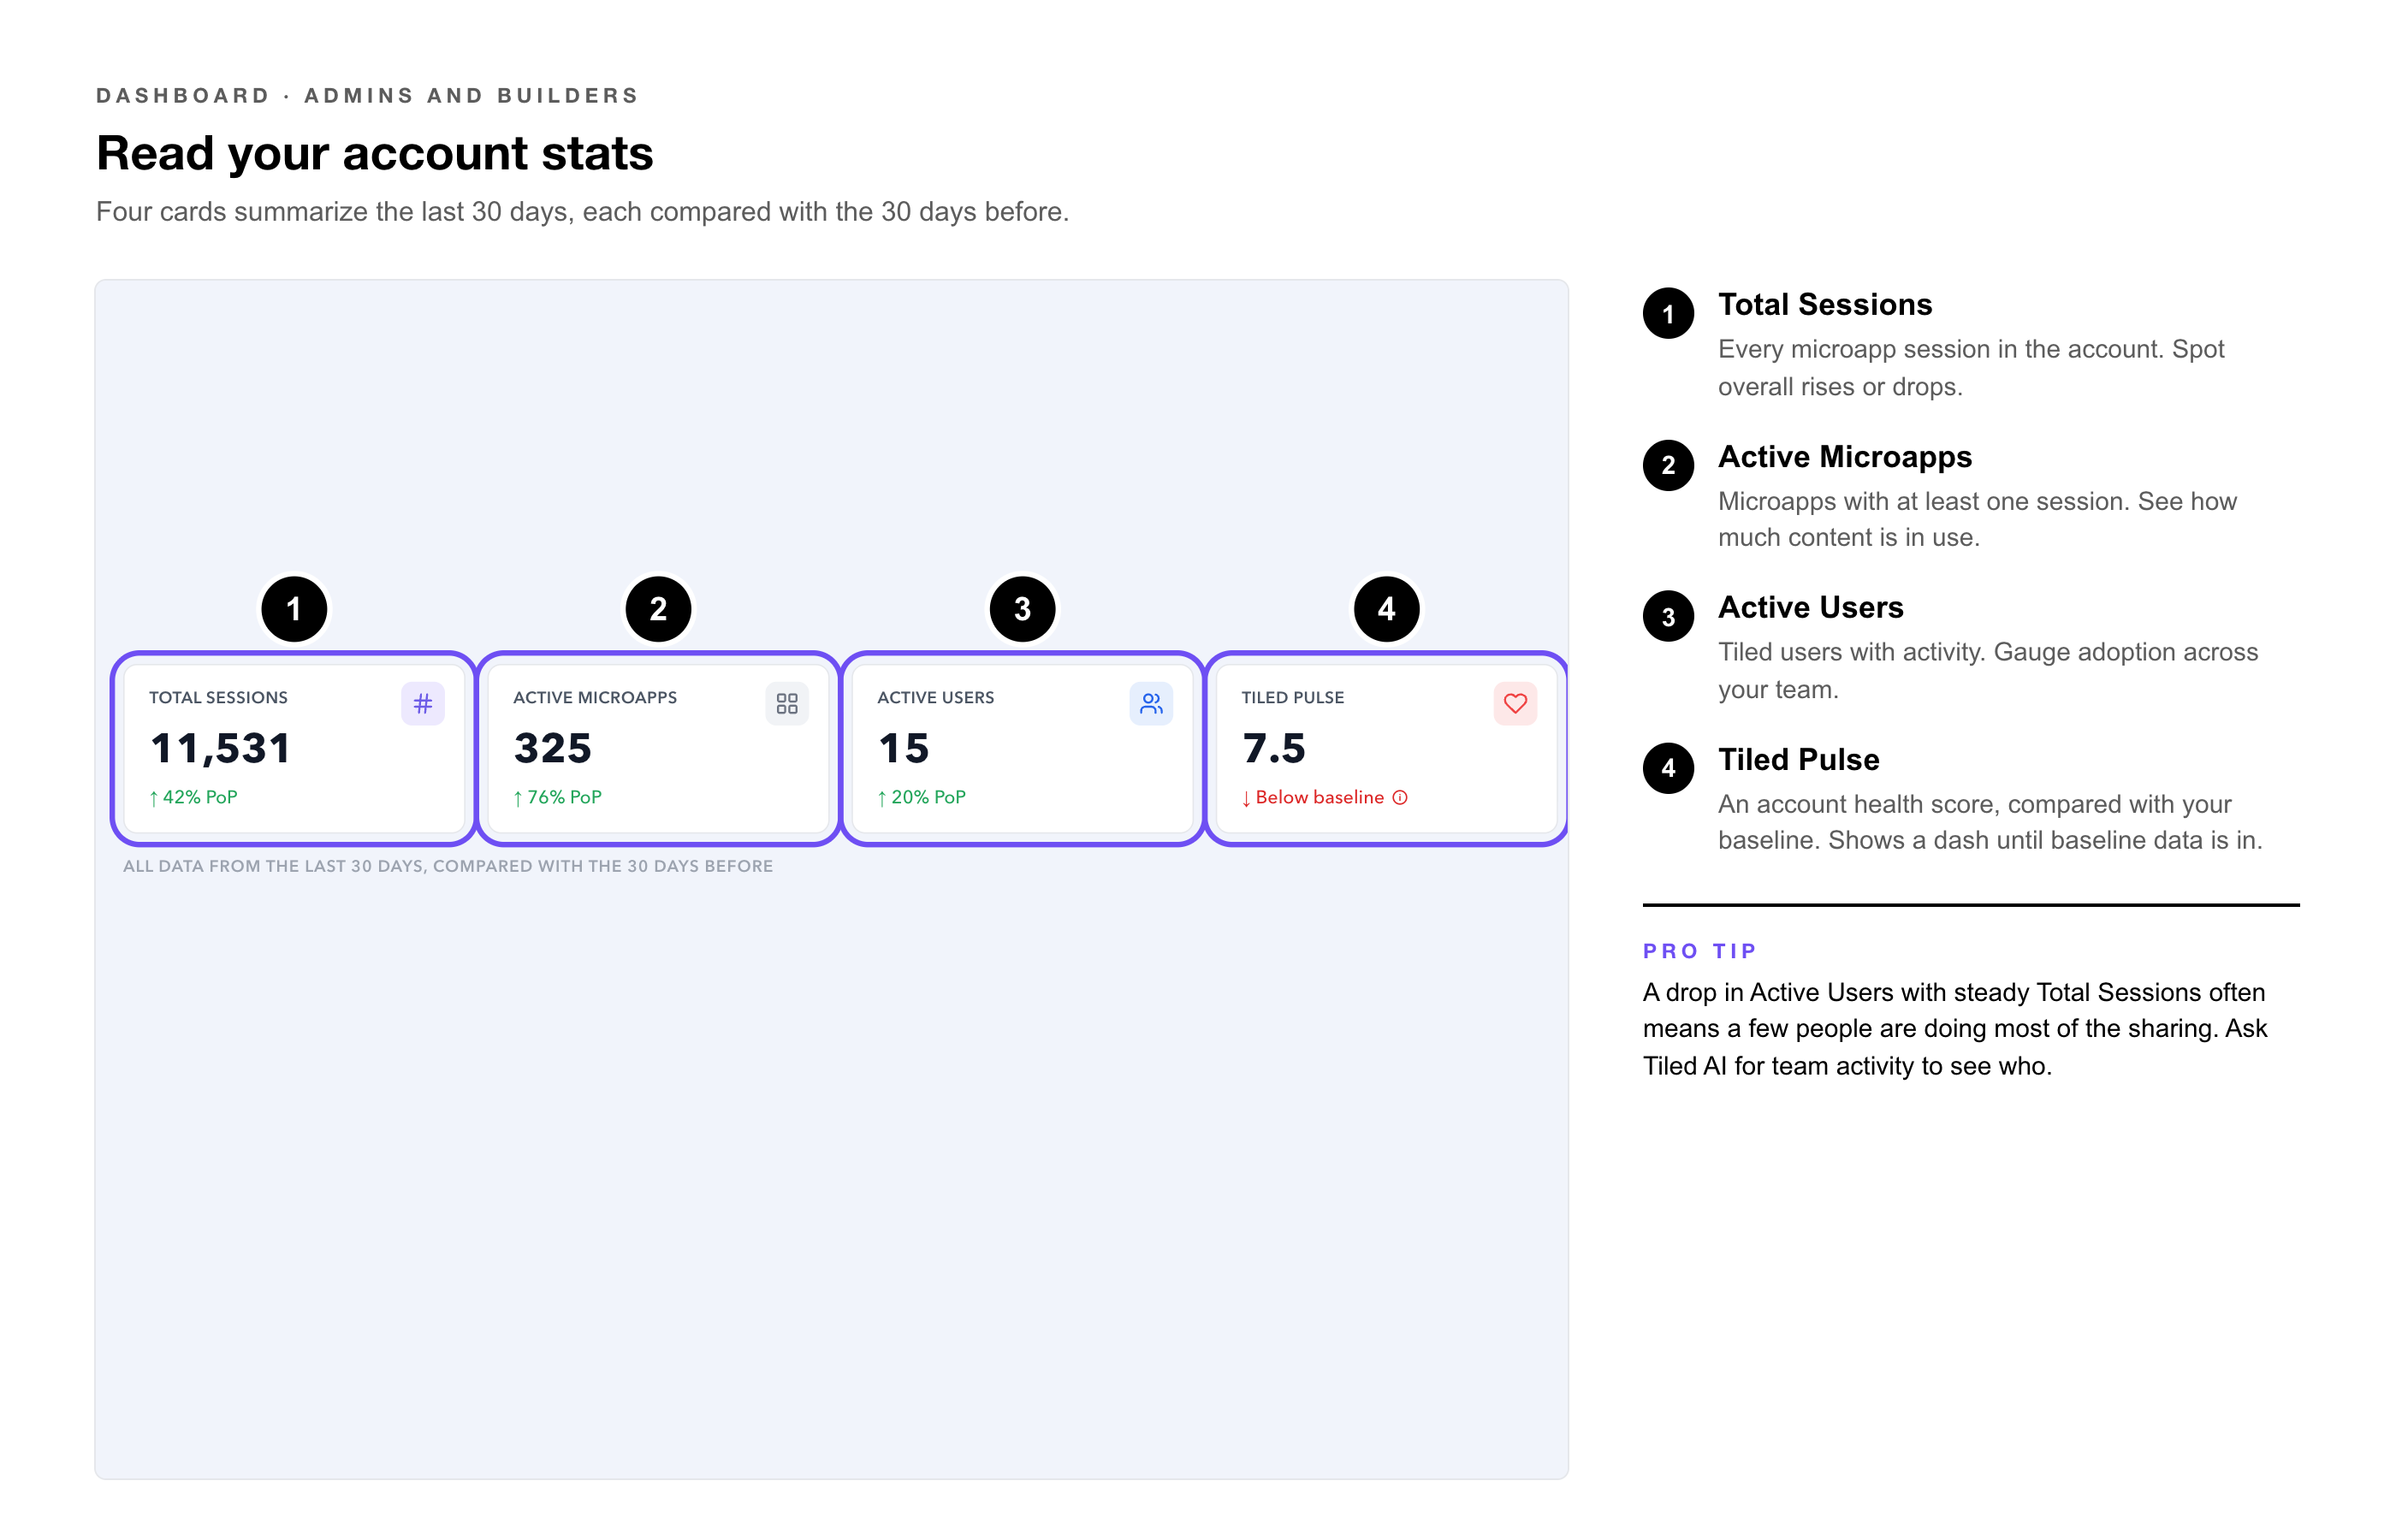
Four cards summarize the last 30 days, each compared with the 30 days before:
|
Stat |
What It Counts |
Use It To |
|
Total Sessions |
Every microapp session in the account. |
Spot overall rises or drops in engagement. |
|
Active Microapps |
Microapps with at least one session. |
See how much of your content is actually in use. |
|
Active Users |
Tiled users with activity. |
Gauge adoption across your team. |
|
Tiled Pulse |
An account health score that builds over time. |
Track account health once baseline data is in. |
|
Pro Tip: A drop in Active Users with steady Total Sessions often means a few people are doing most of the sharing. Ask Tiled AI for team activity to see who. |
Content and Library Performance
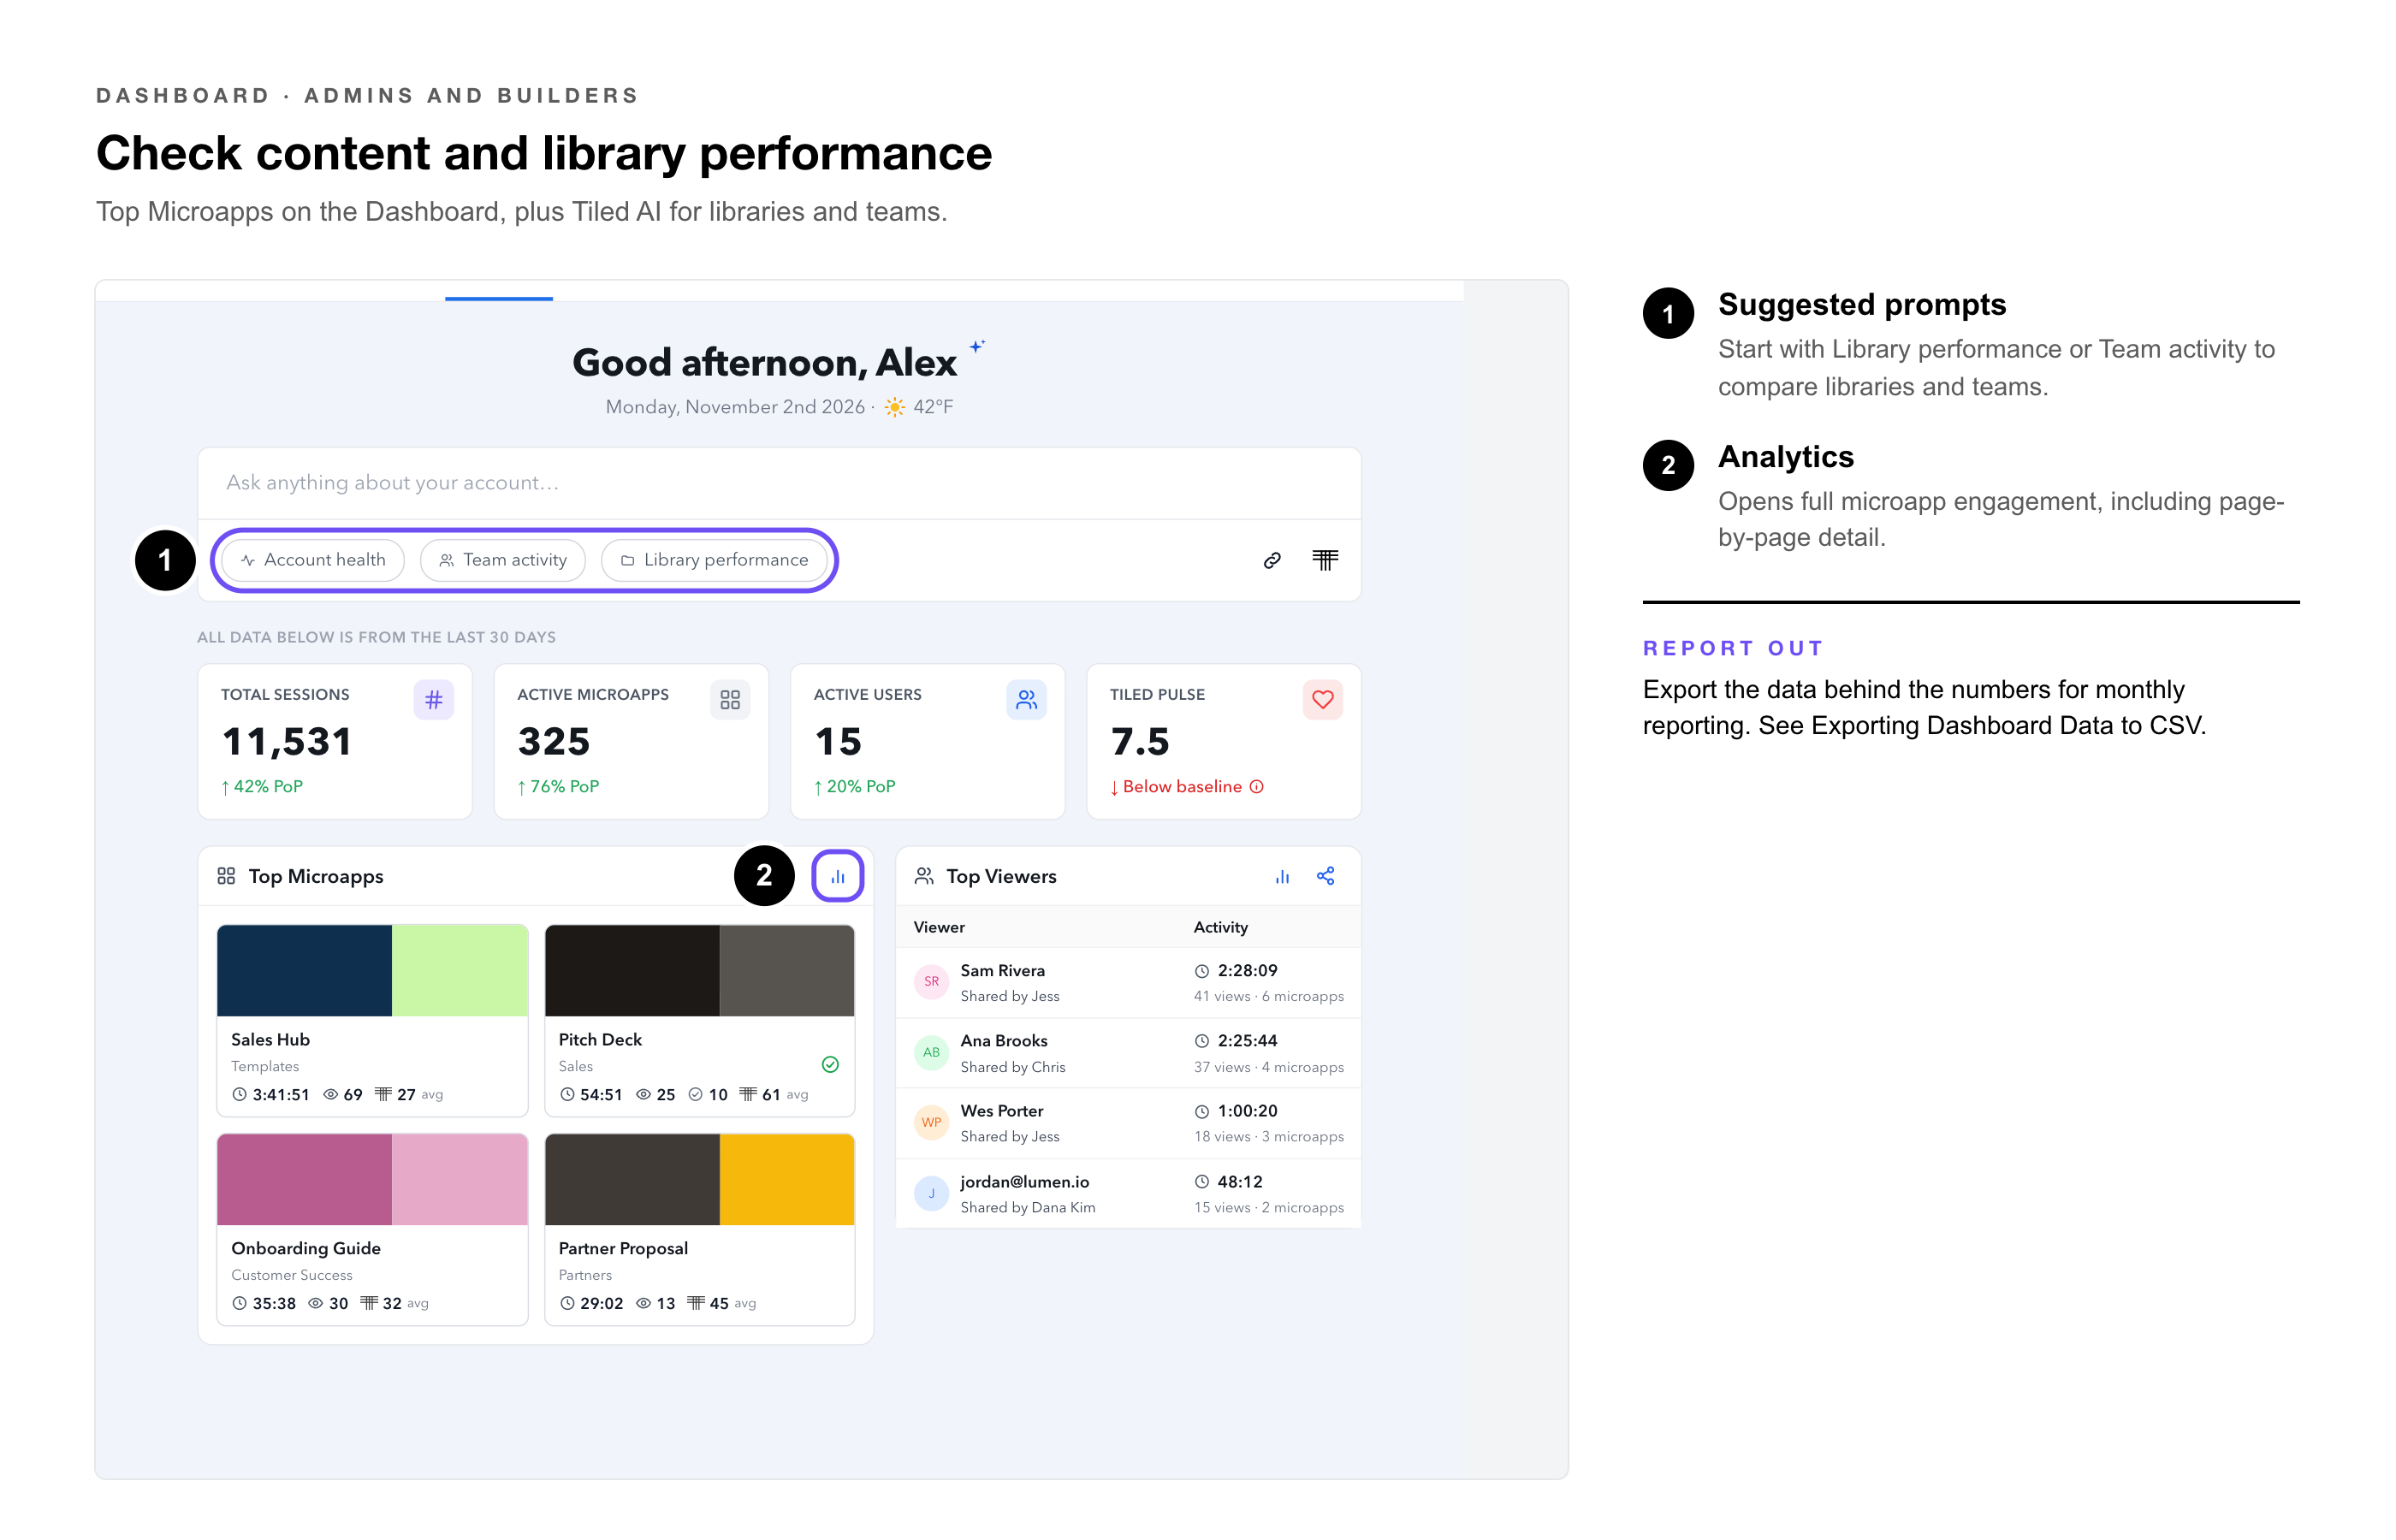
Top Microapps shows what’s getting the most use. Select the analytics icon on a card for its full engagement, including page-by-page detail.
For libraries and teams, ask Tiled AI. The suggested prompts Library performance and Team activity are good starting points.
Questions Admins Ask
|
To Find Out |
Ask Tiled AI |
|
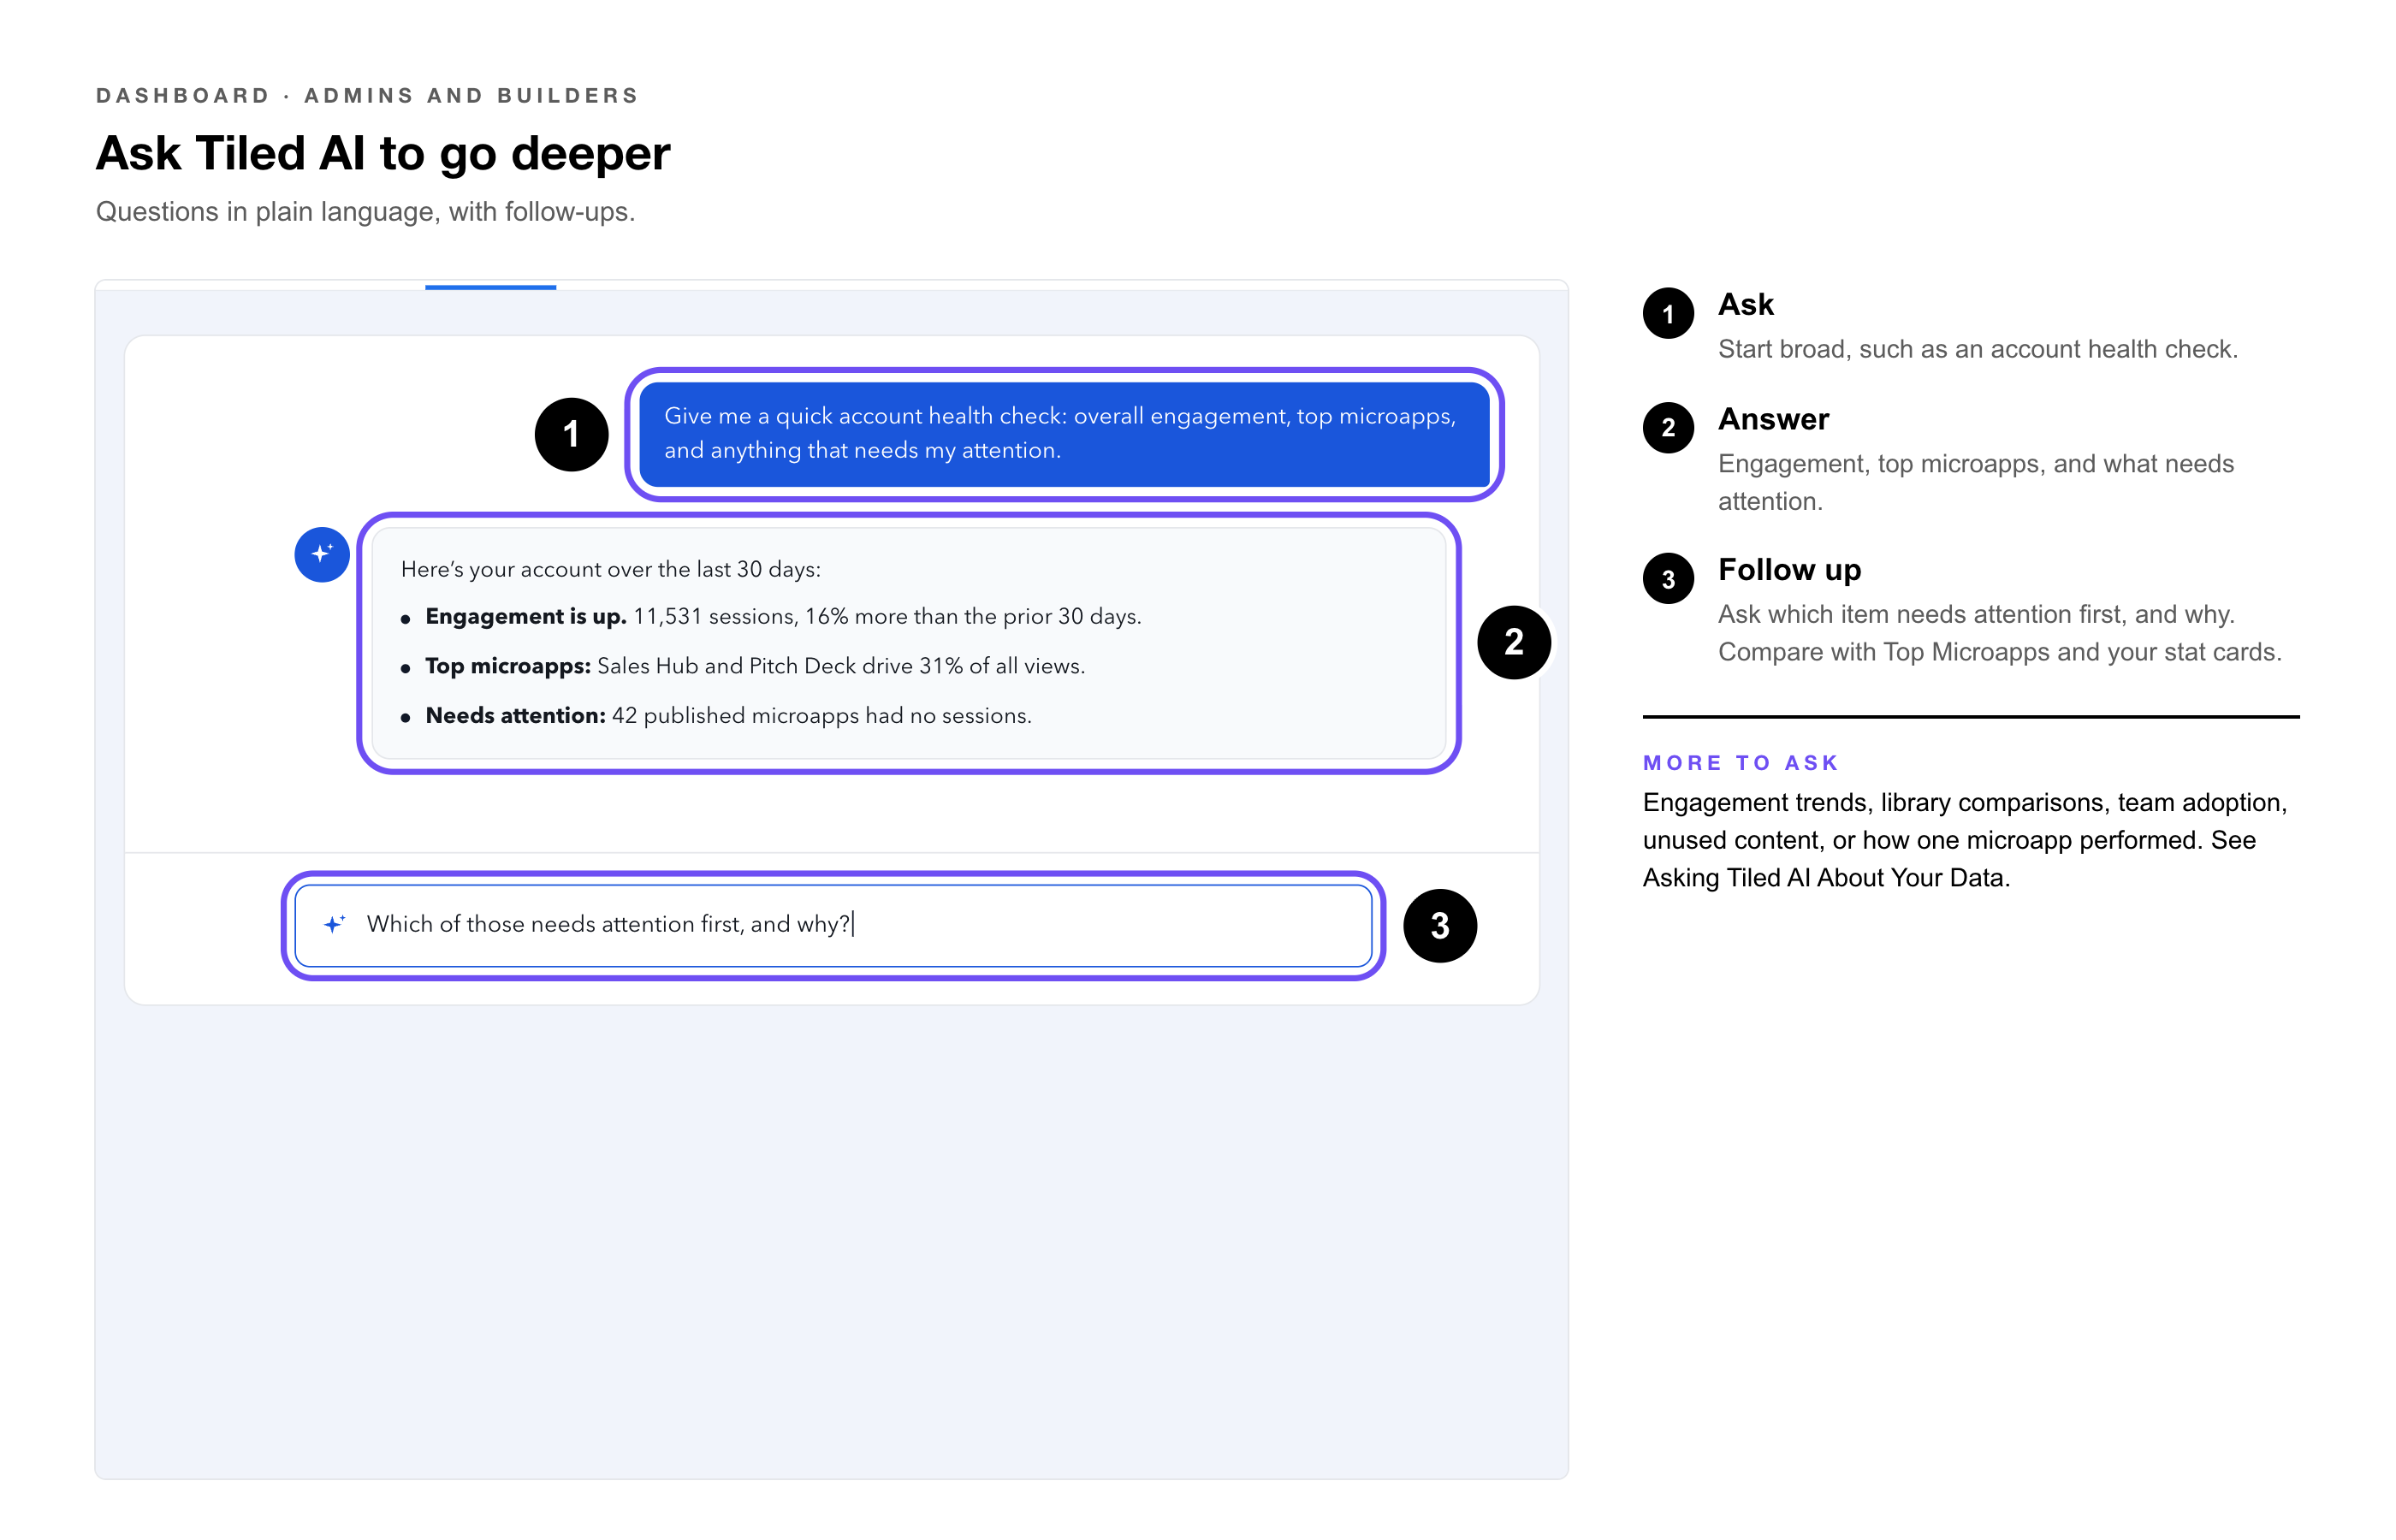
Overall health |
“Give me a quick account health check: overall engagement, top microapps, and anything that needs my attention.” |
|
Trends |
“What’s our engagement trend over the last 30 days?” |
|
Library comparison |
“Which libraries had the most engagement this month, and which had the least?” |
|
Team adoption |
“Who on my team shared the most this month, and who hasn’t shared anything?” |
|
Unused content |
“Which published microapps had no sessions in the last 30 days?” |
|
One microapp |
“How did [microapp name] perform in the last 7 days?” |
See Asking Tiled AI About Your Data for how to write queries and follow up.
Turning Insight Into Action
• Retire unused content — archive microapps with no recent sessions so your library stays current.
• Coach adoption — share Top Microapps with reps who aren’t sharing yet.
• Report out — export the data behind the numbers for monthly reporting. See Exporting Dashboard Data to CSV.
|
Try It Yourself: Ask for an account health check, then follow up with “Which of those needs attention first, and why?” Compare the answer with Top Microapps and your stat cards. |
Common Questions
|
Question |
Answer |
|
Are the stats for the whole account? |
Yes, for the last 30 days, compared with the 30 days before. |
|
Why is Tiled Pulse a dash? |
It needs baseline data first. It appears once enough activity has built up. |
|
Can I change the 30-day window? |
The stat cards use 30 days. Ask Tiled AI about any other period. |
Related Articles
• Microapp Analytics — Full engagement for one microapp.
• Managing Microapps — Archiving and restoring microapps.
• Managing Libraries — How libraries work.
• The Dashboard: Overview — What’s on the Dashboard and how it’s laid out.
• The Dashboard for Sales Reps — Your contacts, follow-ups, and live sessions.
• Asking Tiled AI About Your Data — Writing queries and following up.
• Attaching Files to a Dashboard Prompt — Giving Tiled AI documents and images to work from.
• Exporting Dashboard Data to CSV — Getting the numbers behind the Dashboard into a spreadsheet.